1
The Marginal Product of Labor and the Average Product of Labor (劳动的边际产量与平均产量)
Suppose Jill Johnson hires just one worker; what does that worker have to do?
📖 点击查看译文
假设Jill Johnson雇佣了一个工人;这个工人需要做什么?
Take orders, Make and cook the pizzas, Take pizzas to the tables, Run the cash register, etc.
📖 点击查看译文
接单、制作和烹饪比萨、将比萨送到餐桌、操作收银机等。
By hiring another worker, these tasks could be divided up, allowing for some specialization to take place, resulting from the division of labor.
📖 点击查看译文
通过雇佣另一个工人,这些任务可以被分工,从而产生一些专业化。
Two workers can probably produce more output per worker than one worker can alone.
📖 点击查看译文
两个工人每个工人的产量可能比一个工人单独完成的更多。
Let’s examine what happens as Jill Johnson hires more workers.
📖 点击查看译文
让我们看看Jill Johnson雇佣更多工人时会发生什么。
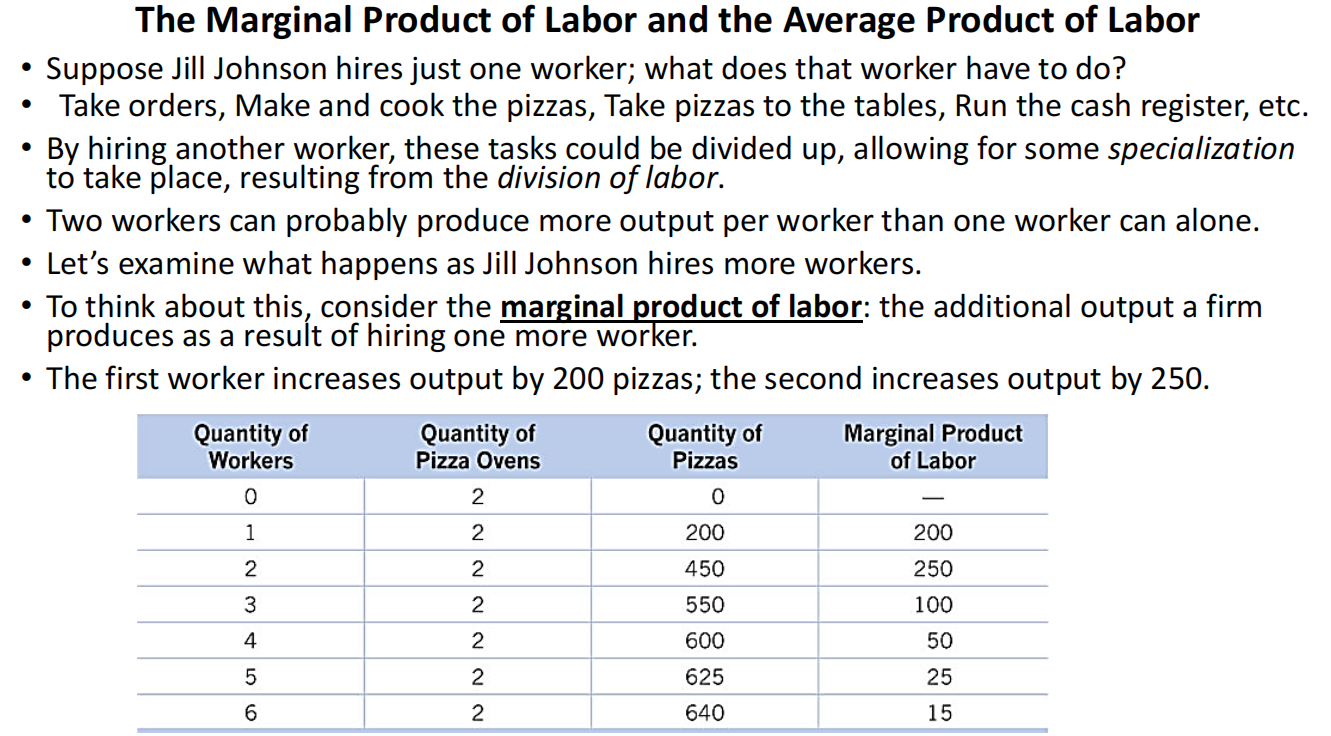
To think about this, consider the marginal product of labor: the additional output a firm produces as a result of hiring one more worker.
📖 点击查看译文
为了思考这个问题,我们需要考虑劳动的边际产量:雇佣一个工人所产生的额外产出。
The first worker increases output by 200 pizzas; the second increases output by 250.
📖 点击查看译文
第一个工人增加了200个比萨的产量;第二个工人增加了250个比萨的产量。
知识点列表与拓展 (Knowledge Points and Extensions):
1. Marginal Product of Labor (劳动的边际产量)
-
解释 (Explanation):
The marginal product of labor is the additional output a firm produces by hiring one more worker.
(劳动的边际产量是指企业雇佣一个工人所带来的额外产出。)
-
例子 (Example):
If hiring a second worker increases output from 200 to 250 pizzas, the marginal product of labor for the second worker is 50 pizzas.
(如果雇佣第二个工人将产量从200个比萨增加到250个比萨,那么第二个工人的边际产量为50个比萨。)
-
拓展 (Extension):
The marginal product of labor is crucial for firms in deciding how many workers to hire, balancing the benefit of additional output with the cost of hiring more workers.
(劳动的边际产量对于企业在决定雇佣多少工人时至关重要,需要在增加产出的利益与雇佣更多工人的成本之间取得平衡。)
2. Division of Labor (劳动分工)
-
解释 (Explanation):
Division of labor is the process by which tasks are divided among workers to increase efficiency and productivity.
(劳动分工是将任务分配给工人,以提高效率和生产力的过程。)
-
例子 (Example):
In a pizza restaurant, workers might specialize in specific tasks like cooking, taking orders, or managing the cash register, which increases overall efficiency.
(在比萨店中,工人可能专门负责某些任务,如烹饪、接单或管理收银机,从而提高整体效率。)
-
拓展 (Extension):
The division of labor can lead to increased productivity as workers become more skilled in their specialized tasks, but it can also lead to diminishing returns if over-specialization occurs.
(劳动分工可以提高生产力,因为工人在专门任务中变得更加熟练,但如果过度专门化,可能会导致边际回报递减。)
2
The Law of Diminishing Returns (递减收益法则)
Additional workers add to the potential output, but not by as much.
📖 点击查看译文
额外的工人增加了潜在产量,但增幅不如预期。
Eventually they start getting in each other’s way, etc., because there is only a fixed number of pizza ovens, cash registers, etc.
📖 点击查看译文
最终他们开始互相干扰,因为比萨烤箱、收银机等的数量是固定的。
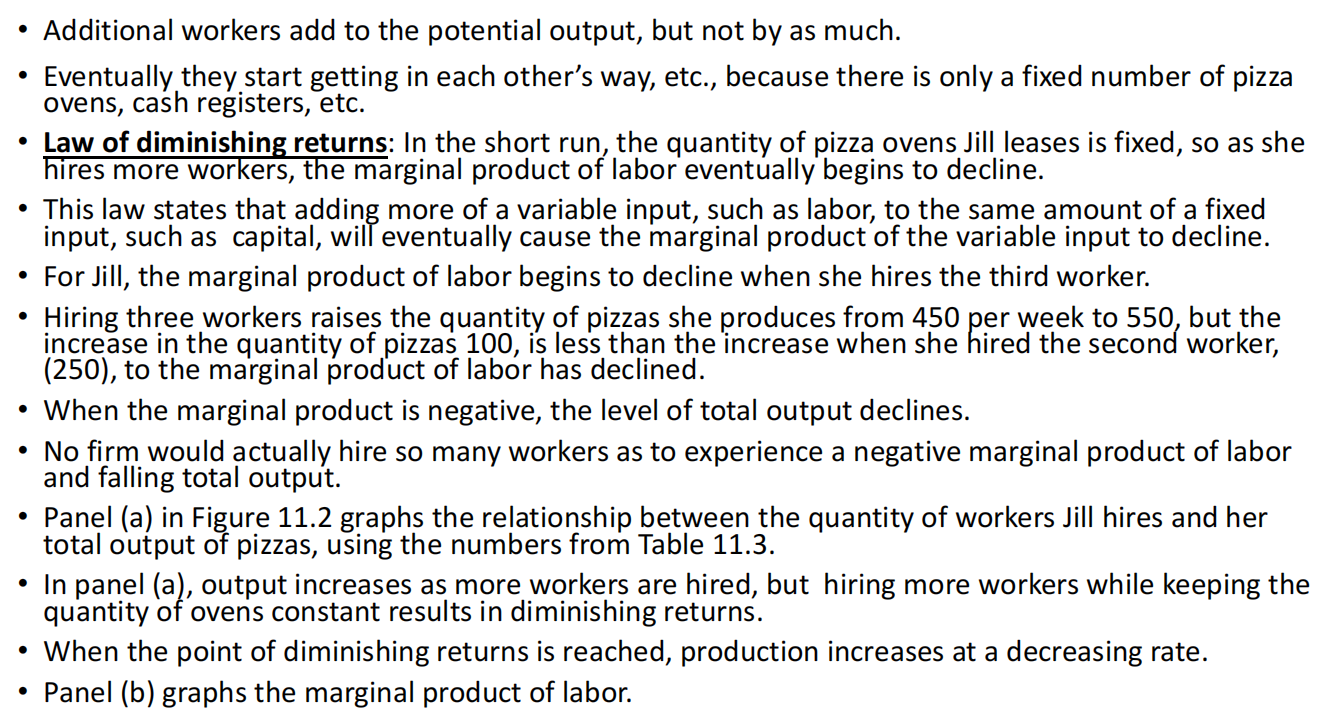
Law of diminishing returns: In the short run, the quantity of pizza ovens Jill leases is fixed, so as she hires more workers, the marginal product of labor eventually begins to decline.
📖 点击查看译文
递减收益法则:在短期内,Jill租赁的比萨烤箱数量是固定的,因此随着她雇佣更多工人,劳动的边际产量最终开始下降。
This law states that adding more of a variable input, such as labor, to the same amount of a fixed input, such as capital, will eventually cause the marginal product of the variable input to decline.
📖 点击查看译文
该法则表明,将更多的可变投入(如劳动)添加到相同数量的固定投入(如资本)中,最终会导致可变投入的边际产量下降。
For Jill, the marginal product of labor begins to decline when she hires the third worker.
📖 点击查看译文
对于Jill来说,劳动的边际产量在她雇佣第三个工人时开始下降。
Hiring three workers raises the quantity of pizzas she produces from 450 per week to 550, but the increase in the quantity of pizzas (100) is less than the increase when she hired the second worker (250), so the marginal product of labor has declined.
📖 点击查看译文
雇佣三个工人将她每周生产的比萨数量从450个提高到550个,但比萨数量的增加(100个)小于雇佣第二个工人时的增量(250个),因此劳动的边际产量已经下降。
When the marginal product is negative, the level of total output declines.
📖 点击查看译文
当边际产量为负时,总产出水平下降。
No firm would actually hire so many workers as to experience a negative marginal product of labor and falling total output.
📖 点击查看译文
没有公司会实际雇佣这么多工人,以至于经历负的劳动边际产量和下降的总产出。
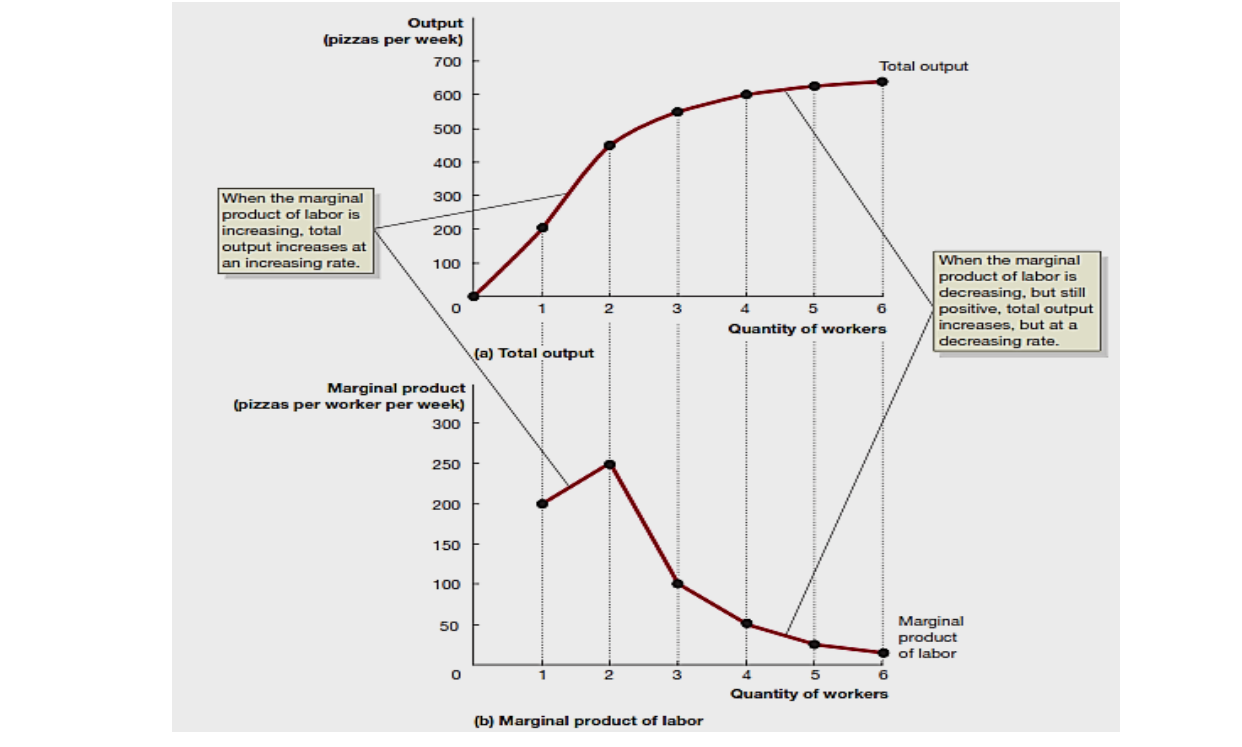
Panel (a) in Figure 11.2 graphs the relationship between the quantity of workers Jill hires and her total output of pizzas, using the numbers from Table 11.3.
📖 点击查看译文
图11.2中的面板(a)图示了Jill雇佣工人数量与她的比萨总产量之间的关系,使用了表11.3中的数据。
In panel (a), output increases as more workers are hired, but hiring more workers while keeping the quantity of ovens constant results in diminishing returns.
📖 点击查看译文
在面板(a)中,随着更多工人的雇佣,产出增加,但在保持烤箱数量不变的情况下雇佣更多工人会导致递减收益。
When the point of diminishing returns is reached, production increases at a decreasing rate.
📖 点击查看译文
当递减收益的临界点到达时,生产以递减的速度增加。
Panel (b) graphs the marginal product of labor.
📖 点击查看译文
面板(b)图示了劳动的边际产量。
知识点列表与拓展 (Knowledge Points and Extensions):
1. Law of Diminishing Returns (递减收益法则)
-
解释 (Explanation):
The law of diminishing returns states that as more units of a variable input are added to a fixed input, the marginal product of the variable input will eventually decline.
(递减收益法则指出,随着更多单位的可变投入添加到固定投入中,可变投入的边际产量最终会下降。)
-
例子 (Example):
As Jill hires more workers, each additional worker contributes less to the total pizza output due to the fixed number of ovens and equipment.
(随着Jill雇佣更多工人,由于烤箱和设备数量固定,每个额外的工人对比萨总产出的贡献会减少。)
-
拓展 (Extension):
This law is critical for firms to understand when deciding how many workers to hire, ensuring that they do not hire beyond the point where additional workers no longer improve efficiency.
(这一法则对于企业在决定雇佣多少工人时至关重要,确保他们不会雇佣超过边际产量不再提高效率的工人数量。)
2. Marginal Product of Labor (劳动的边际产量)
-
解释 (Explanation):
The marginal product of labor refers to the additional output produced by one more worker.
(劳动的边际产量是指雇佣一个额外工人所生产的额外产出。)
-
例子 (Example):
Hiring the second worker increases output by 250 pizzas, but the third worker only increases output by 100 pizzas, showing the decline in the marginal product of labor.
(雇佣第二个工人增加了250个比萨的产量,但第三个工人只增加了100个比萨的产量,显示了劳动的边际产量的下降。)
-
拓展 (Extension):
When the marginal product of labor becomes negative, firms must reconsider their hiring decisions, as adding more workers would actually reduce total output.
(当劳动的边际产量变为负数时,企业必须重新考虑雇佣决策,因为增加工人实际上会减少总产出。)
3
4
The Relationship between Marginal Product and Average Product (边际产量与平均产量的关系)
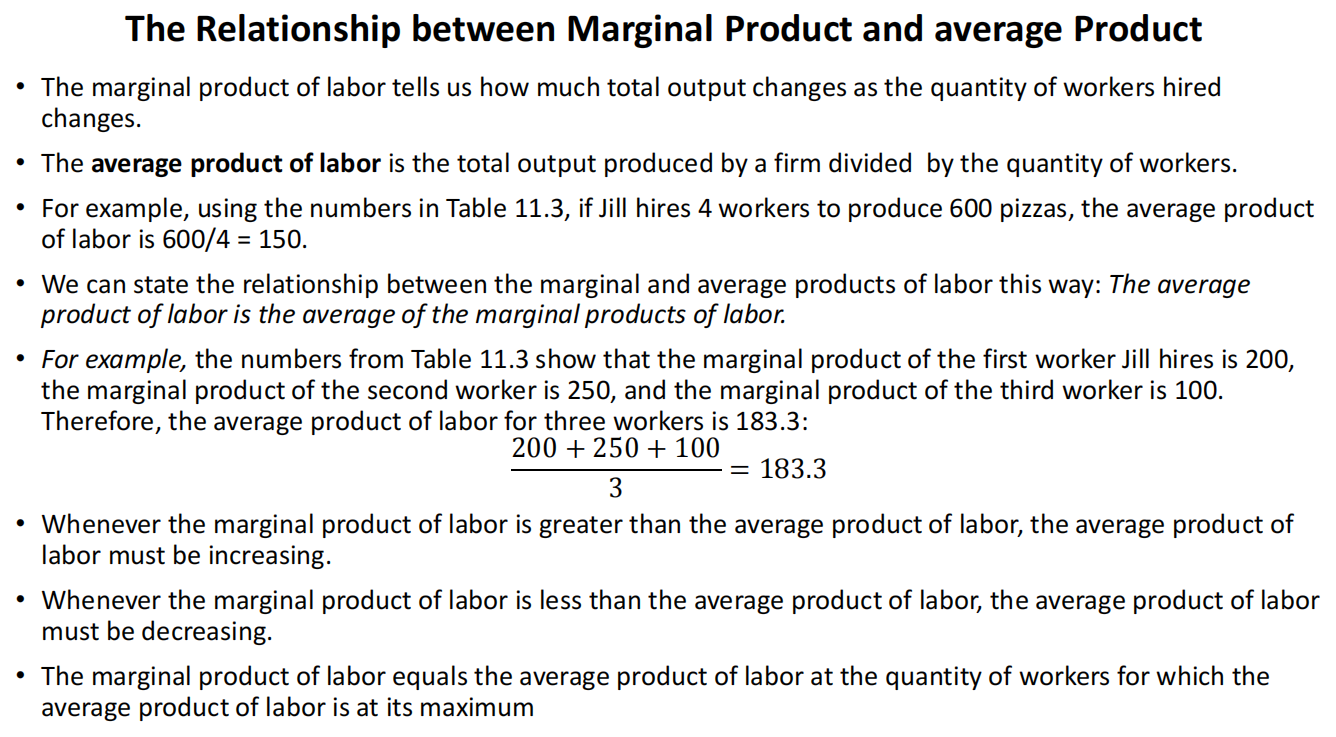
The marginal product of labor tells us how much total output changes as the quantity of workers hired changes.
📖 点击查看译文
劳动的边际产量告诉我们,当雇佣工人数量发生变化时,总产量发生了多少变化。
The average product of labor is the total output produced by a firm divided by the quantity of workers.
📖 点击查看译文
劳动的平均产量是指由企业生产的总产出除以工人数量。
For example, using the numbers in Table 11.3, if Jill hires 4 workers to produce 600 pizzas, the average product of labor is 600/4 = 150.
📖 点击查看译文
例如,使用表11.3中的数据,如果Jill雇佣4个工人生产600个比萨,那么劳动的平均产量是600/4 = 150。
We can state the relationship between the marginal and average products of labor this way: The average product of labor is the average of the marginal products of labor.
📖 点击查看译文
我们可以这样陈述劳动的边际产量与平均产量之间的关系:劳动的平均产量是劳动的边际产量的平均值。
For example, the numbers from Table 11.3 show that the marginal product of the first worker Jill hires is 200, the marginal product of the second worker is 250, and the marginal product of the third worker is 100. Therefore, the average product of labor for three workers is 200 + 250 + 100 / 3 = 183.3
📖 点击查看译文
例如,表11.3中的数据表明,Jill雇佣的第一个工人的边际产量是200,第二个工人的边际产量是250,第三个工人的边际产量是100。因此,三个工人的劳动平均产量是200 + 250 + 100 / 3 = 183.3
Whenever the marginal product of labor is greater than the average product of labor, the average product of labor must be increasing.
📖 点击查看译文
当劳动的边际产量大于劳动的平均产量时,劳动的平均产量一定在增加。
Whenever the marginal product of labor is less than the average product of labor, the average product of labor must be decreasing.
📖 点击查看译文
当劳动的边际产量小于劳动的平均产量时,劳动的平均产量一定在减少。
The marginal product of labor equals the average product of labor at the quantity of workers for which the average product of labor is at its maximum.
📖 点击查看译文
劳动的边际产量等于劳动的平均产量,当且仅当工人的数量使得劳动的平均产量达到最大值时。
知识点列表与拓展 (Knowledge Points and Extensions):
1. Marginal Product of Labor (劳动的边际产量)
-
解释 (Explanation):
The marginal product of labor refers to the additional output produced when one more worker is hired.
(劳动的边际产量是指雇佣一个额外工人所增加的产出。)
-
例子 (Example):
The first worker increases output by 200 pizzas, and the second worker increases it by 250 pizzas.
(第一个工人将产量提高了200个比萨,第二个工人将产量提高了250个比萨。)
-
拓展 (Extension):
The marginal product of labor can help firms decide the optimal number of workers to hire to maximize output without overstaffing.
(劳动的边际产量可以帮助企业决定雇佣的最优工人数量,以最大化产出而不造成过多的员工。)
2. Average Product of Labor (劳动的平均产量)
-
解释 (Explanation):
The average product of labor is the total output divided by the number of workers.
(劳动的平均产量是总产出除以工人数量。)
-
例子 (Example):
If Jill hires 4 workers and produces 600 pizzas, the average product of labor is 150.
(如果Jill雇佣4个工人并生产600个比萨,那么劳动的平均产量是150。)
-
拓展 (Extension):
The average product of labor helps to measure the efficiency of workers in producing output relative to the total workforce.
(劳动的平均产量有助于衡量工人相对于总劳动力在生产产出方面的效率。)
3. Relationship between Marginal Product and Average Product (边际产量与平均产量的关系)
-
解释 (Explanation):
The relationship shows that when the marginal product is higher than the average product, the average product increases. Conversely, when the marginal product is lower, the average product decreases.
(这一关系表明,当边际产量高于平均产量时,平均产量增加;反之,当边际产量低于平均产量时,平均产量减少。)
-
例子 (Example):
When the marginal product of the third worker is 100 and the average product is 183.3, it indicates that the average product is decreasing.
(当第三个工人的边际产量为100且平均产量为183.3时,表明平均产量正在减少。)
-
拓展 (Extension):
The point at which the marginal product equals the average product is where the average product is maximized.
(边际产量等于平均产量的点是平均产量最大化的地方。)
5
An Example of Marginal and Average Values: College Grades (边际值与平均值的例子:大学成绩)
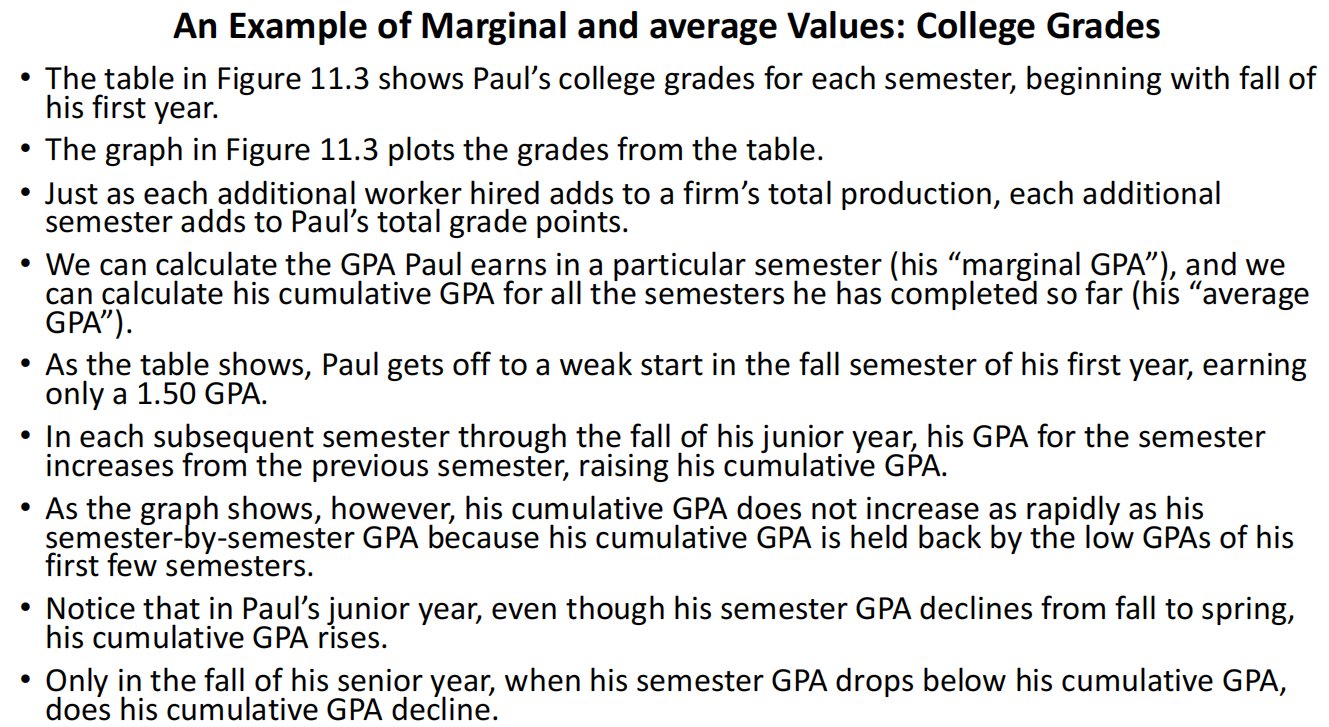
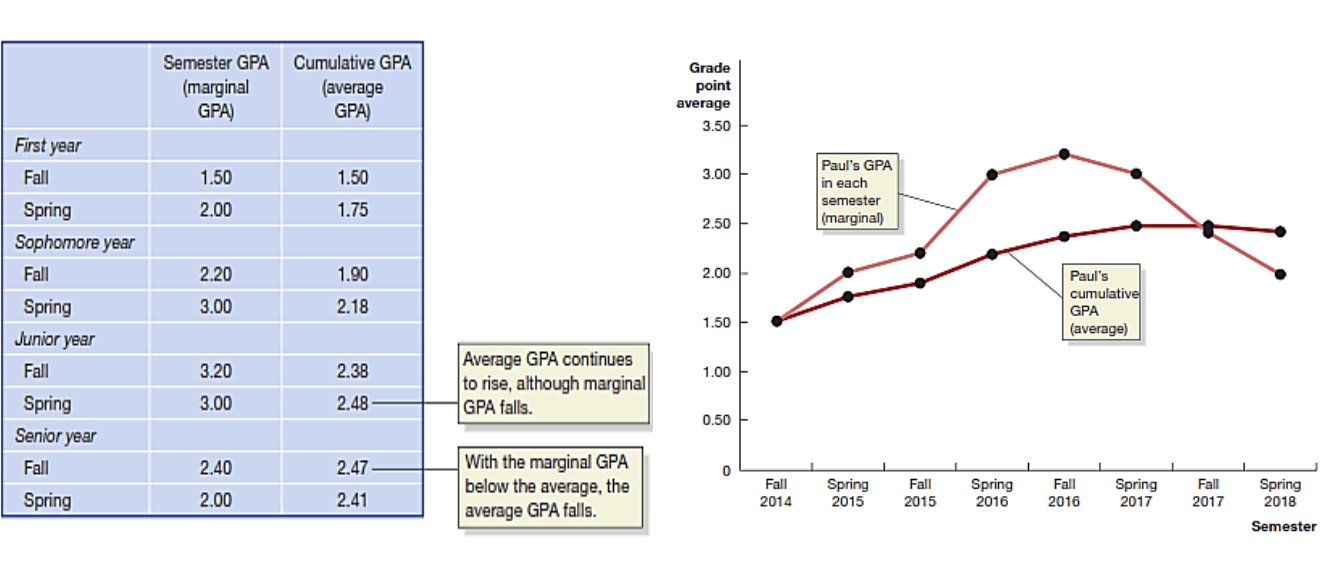
The table in Figure 11.3 shows Paul’s college grades for each semester, beginning with fall of his first year.
📖 点击查看译文
图11.3中的表格展示了Paul在每个学期的大学成绩,从他第一年的秋季学期开始。
The graph in Figure 11.3 plots the grades from the table.
📖 点击查看译文
图11.3中的图表绘制了表格中的成绩。
Just as each additional worker hired adds to a firm’s total production, each additional semester adds to Paul’s total grade points.
📖 点击查看译文
就像每增加一个工人就能为企业的总产出做出贡献一样,每增加一个学期也能增加Paul的总成绩。
We can calculate the GPA Paul earns in a particular semester (his “marginal GPA”), and we can calculate his cumulative GPA for all the semesters he has completed so far (his average GPA).
📖 点击查看译文
我们可以计算Paul在某个学期的GPA(他的“边际GPA”),还可以计算他迄今为止完成的所有学期的累计GPA(他的平均GPA)。
As the table shows, Paul gets off to a weak start in the fall semester of his first year, earning only a 1.50 GPA.
📖 点击查看译文
正如表格所示,Paul在第一年秋季学期起步较弱,仅获得了1.50的GPA。
In each subsequent semester through the fall of his junior year, his GPA for the semester increases from the previous semester, raising his cumulative GPA.
📖 点击查看译文
在随后的每个学期,直到他大三的秋季学期,他的学期GPA都比上一个学期有所提高,从而提升了他的累计GPA。
As the graph shows, however, his cumulative GPA does not increase as rapidly as his semester-by-semester GPA because his cumulative GPA is held back by the low GPAs of his first few semesters.
📖 点击查看译文
然而,正如图表所示,他的累计GPA并没有像每学期的GPA那样迅速增长,因为他的累计GPA受到了他前几个学期低GPA的制约。
Notice that in Paul’s junior year, even though his semester GPA declines from fall to spring, his cumulative GPA rises.
📖 点击查看译文
注意,在Paul的大三学年,尽管他的学期GPA从秋季到春季有所下降,但他的累计GPA却上升了。
Only in the fall of his senior year, when his semester GPA drops below his cumulative GPA, does his cumulative GPA decline.
📖 点击查看译文
只有在他大四的秋季学期,当他的学期GPA低于累计GPA时,他的累计GPA才会下降。
知识点列表与拓展 (Knowledge Points and Extensions):
1. Marginal GPA (边际GPA)
-
解释 (Explanation):
The marginal GPA refers to the GPA Paul earns in a particular semester, representing the additional grade points earned during that semester.
(边际GPA是指Paul在某个学期获得的GPA,代表该学期获得的额外学分。)
-
例子 (Example):
If Paul earns a GPA of 3.0 in one semester, that GPA would be considered his marginal GPA for that semester.
(如果Paul在某个学期获得了3.0的GPA,那么这个GPA就被认为是他的边际GPA。)
-
拓展 (Extension):
Marginal GPA can be used to assess how much improvement Paul makes in each semester and whether his academic performance is getting better or worse.
(边际GPA可以用来评估Paul在每个学期的进步情况,以及他的学业表现是提高还是下降。)
2. Cumulative GPA (累计GPA)
-
解释 (Explanation):
Cumulative GPA is the average GPA of all semesters completed up to that point. It reflects Paul’s overall academic performance.
(累计GPA是指到目前为止所有学期的GPA平均值,反映了Paul的整体学业表现。)
-
例子 (Example):
If Paul has a cumulative GPA of 3.5 after completing 5 semesters, it means his average GPA across all semesters is 3.5.
(如果Paul完成了5个学期并且累计GPA为3.5,这意味着他所有学期的平均GPA是3.5。)
-
拓展 (Extension):
Cumulative GPA is often used by schools and employers as a measure of a student’s long-term academic success.
(累计GPA通常被学校和雇主用作衡量学生长期学业成功的标准。)
3. The Relationship Between Marginal and Cumulative GPA (边际GPA与累计GPA的关系)
-
解释 (Explanation):
The relationship between marginal GPA and cumulative GPA shows that while the marginal GPA may fluctuate, the cumulative GPA provides an overall picture of a student’s performance.
(边际GPA与累计GPA之间的关系表明,虽然边际GPA可能波动,但累计GPA提供了学生整体表现的图景。)
-
例子 (Example):
If Paul’s semester GPA drops but his cumulative GPA continues to rise, it suggests that his previous semesters were strong enough to keep his cumulative GPA increasing.
(如果Paul的学期GPA下降,但他的累计GPA仍然上升,这表明他之前的学期表现足够强劲,保持了累计GPA的增长。)
-
拓展 (Extension):
Cumulative GPA serves as a summary of all past academic performance, while marginal GPA gives insight into how well a student is doing in the current semester.
(累计GPA作为所有过去学业表现的总结,而边际GPA则为学生当前学期的表现提供了洞察。)
6
7
The Relationship between Short-Run Production and Short-Run Cost (短期生产与短期成本的关系)
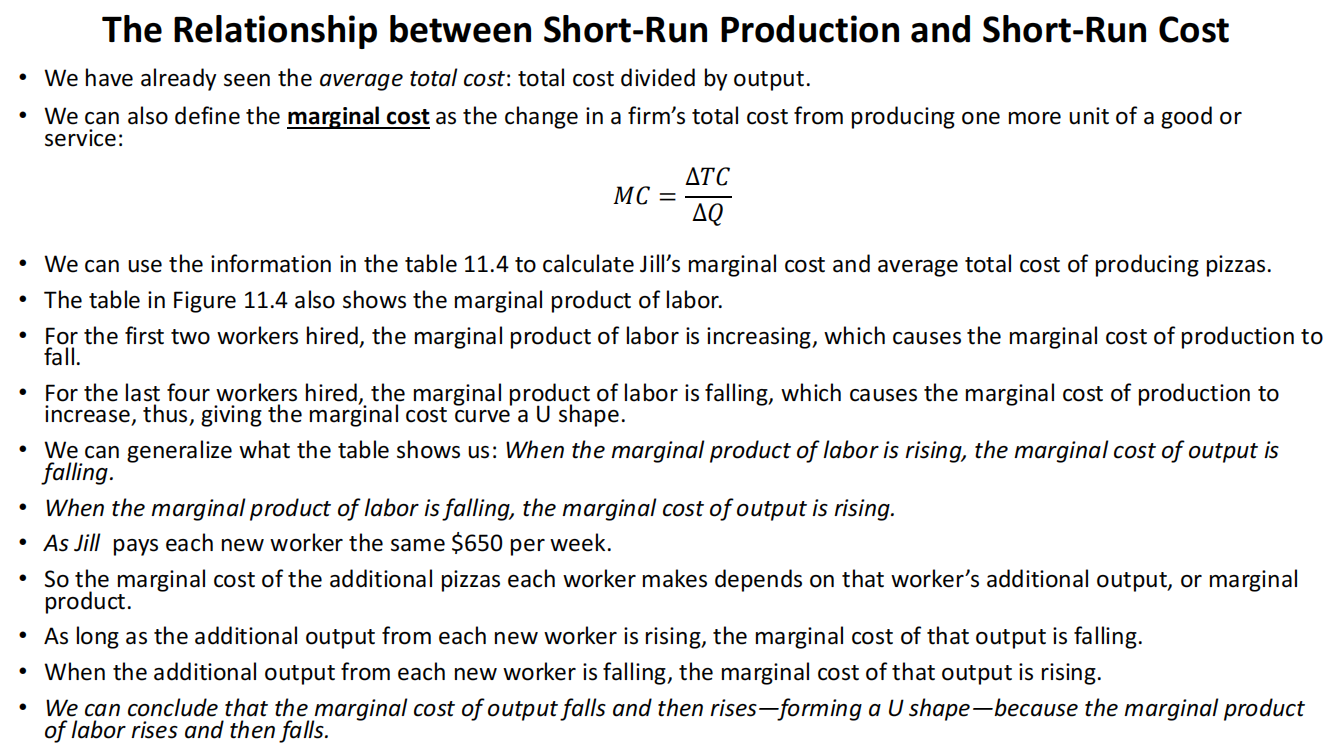
We have already seen the average total cost: total cost divided by output.
📖 点击查看译文
我们已经看到了平均总成本:总成本除以产出。
We can also define the marginal cost as the change in a firm’s total cost from producing one more unit of a good or service:
📖 点击查看译文
我们还可以定义边际成本为生产一单位商品或服务所带来的总成本变化:
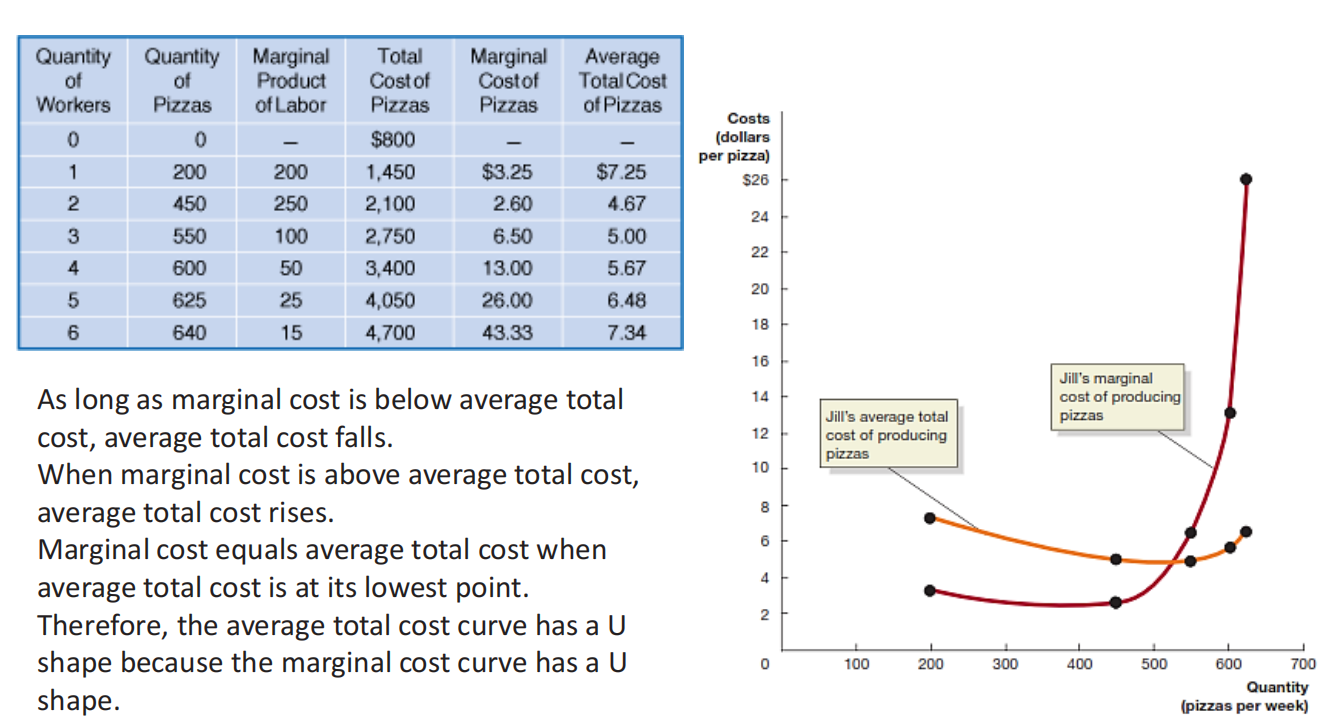
We can use the information in the table 11.4 to calculate Jill’s marginal cost and average total cost of producing pizzas.
📖 点击查看译文
我们可以使用表格11.4中的信息来计算Jill生产披萨的边际成本和平均总成本。
The table in Figure 11.4 also shows the marginal product of labor.
📖 点击查看译文
图11.4中的表格还展示了劳动的边际产量。
For the first two workers hired, the marginal product of labor is increasing, which causes the marginal cost of production to fall.
📖 点击查看译文
对于前两个雇佣的工人,劳动的边际产量正在增加,这导致生产的边际成本下降。
For the last four workers hired, the marginal product of labor is falling, which causes the marginal cost of production to increase, thus, giving the marginal cost curve a U shape.
📖 点击查看译文
对于最后四个雇佣的工人,劳动的边际产量正在下降,这导致生产的边际成本上升,从而使边际成本曲线呈现U形。
We can generalize what the table shows us: When the marginal product of labor is rising, the marginal cost of output is falling.
📖 点击查看译文
我们可以概括表格所示的内容:当劳动的边际产量上升时,产出的边际成本下降。
When the marginal product of labor is falling, the marginal cost of output is rising.
📖 点击查看译文
当劳动的边际产量下降时,产出的边际成本上升。
As Jill pays each new worker the same $650 per week.
📖 点击查看译文
Jill为每个新雇佣的工人支付相同的每周650美元。
So the marginal cost of the additional pizzas each worker makes depends on that worker’s additional output, or marginal product.
📖 点击查看译文
因此,每个工人制作的额外披萨的边际成本取决于该工人的额外产出或边际产量。
As long as the additional output from each new worker is rising, the marginal cost of that output is falling.
📖 点击查看译文
只要每个新工人的额外产出在增加,产出的边际成本就会下降。
When the additional output from each new worker is falling, the marginal cost of that output is rising.
📖 点击查看译文
当每个新工人的额外产出下降时,产出的边际成本会上升。
We can conclude that the marginal cost of output falls and then rises—forming a U shape—because the marginal product of labor rises and then falls.
📖 点击查看译文
我们可以得出结论,产出的边际成本先下降然后上升,形成U形曲线,因为劳动的边际产量先上升然后下降。
知识点列表与拓展 (Knowledge Points and Extensions):
1. Marginal Cost (边际成本)
-
解释 (Explanation):
Marginal cost is the change in total cost that results from producing one more unit of a good or service.
(边际成本是生产一单位商品或服务所带来的总成本变化。)
-
例子 (Example):
If producing one more pizza increases the total cost by 10.
(如果生产一张披萨使总成本增加10美元,那么生产这张披萨的边际成本就是10美元。)
-
拓展 (Extension):
Marginal cost helps firms determine the most cost-effective level of production and whether increasing output will be profitable.
(边际成本帮助企业确定最具成本效益的生产水平,并评估增加产出是否盈利。)
2. Marginal Product of Labor (劳动的边际产量)
-
解释 (Explanation):
The marginal product of labor refers to the additional output produced by one more unit of labor, holding other inputs constant.
(劳动的边际产量是指在其他生产要素不变的情况下,增加一单位劳动所产生的额外产出。)
-
例子 (Example):
If adding a second worker increases output from 200 pizzas to 450 pizzas, the marginal product of labor for the second worker is 250 pizzas.
(如果增加第二个工人使产量从200张披萨增加到450张披萨,那么第二个工人的边际产量是250张披萨。)
-
拓展 (Extension):
The relationship between marginal product of labor and marginal cost plays a crucial role in determining the efficiency of labor usage in production.
(劳动的边际产量与边际成本之间的关系在决定劳动使用效率方面起着至关重要的作用。)
3. U-shaped Marginal Cost Curve (U形边际成本曲线)
-
解释 (Explanation):
A U-shaped marginal cost curve occurs because the marginal product of labor first increases and then decreases, causing the marginal cost of output to initially fall and then rise.
(U形边际成本曲线的出现是因为劳动的边际产量先增加后减少,导致产出的边际成本先下降后上升。)
-
例子 (Example):
In a pizza production example, as more workers are hired, the initial increase in output leads to falling marginal costs, but as overcrowding occurs, marginal costs start to rise again.
(在披萨生产的例子中,随着更多工人的雇佣,最初产出的增加导致边际成本下降,但随着人手过多,边际成本开始再次上升。)
-
拓展 (Extension):
Understanding the U-shape of marginal cost curves helps firms optimize their labor and capital usage to minimize costs.
(了解边际成本曲线的U形有助于企业优化劳动和资本使用,以最小化成本。)
7
The Relationship Between Marginal Cost and Average Total Cost (边际成本与平均总成本的关系)
As long as marginal cost is below average total cost, average total cost falls.
📖 点击查看译文
只要边际成本低于平均总成本,平均总成本就会下降。
When marginal cost is above average total cost, average total cost rises.
📖 点击查看译文
当边际成本高于平均总成本时,平均总成本会上升。
Marginal cost equals average total cost when average total cost is at its lowest point.
📖 点击查看译文
当平均总成本处于最低点时,边际成本等于平均总成本。
Therefore, the average total cost curve has a U shape because the marginal cost curve has a U shape.
📖 点击查看译文
因此,平均总成本曲线呈U形,因为边际成本曲线呈U形。
知识点列表与拓展 (Knowledge Points and Extensions):
1. Marginal Cost and Average Total Cost Relationship (边际成本与平均总成本的关系)
-
解释 (Explanation):
When marginal cost is less than average total cost, the average total cost decreases. When marginal cost is greater than average total cost, average total cost increases.
(当边际成本低于平均总成本时,平均总成本下降;当边际成本高于平均总成本时,平均总成本上升。)
-
例子 (Example):
If the marginal cost of producing a pizza is 10, the average total cost will decrease. However, if the marginal cost increases to $12, the average total cost will increase.
(如果生产一张披萨的边际成本为8美元,平均总成本为10美元,那么平均总成本会下降。然而,如果边际成本增加到12美元,平均总成本会增加。)
-
拓展 (Extension):
The relationship between marginal cost and average total cost is critical for firms to determine the optimal level of production.
(边际成本与平均总成本之间的关系对企业确定最佳生产水平至关重要。)
2. U-shaped Cost Curves (U形成本曲线)
-
解释 (Explanation):
Both marginal cost and average total cost curves typically have a U shape, reflecting increasing returns to labor at first, followed by diminishing returns.
(边际成本和平均总成本曲线通常呈U形,反映了最初劳动的收益递增,然后是收益递减。)
-
例子 (Example):
As a pizza shop hires more workers, the first few workers increase output efficiently, causing costs to fall. However, after reaching a certain point, additional workers may overcrowd, causing costs to rise again.
(当披萨店雇佣更多工人时,前几个工人高效地增加产出,导致成本下降。然而,达到一定点后,额外的工人可能会导致拥挤,导致成本再次上升。)
-
拓展 (Extension):
Firms aim to operate where their average total cost curve is at its lowest point to maximize efficiency and minimize costs.
(企业旨在其平均总成本曲线最低点运作,以最大化效率并最小化成本。)
8
Graphing Cost Curves (成本曲线的绘制)
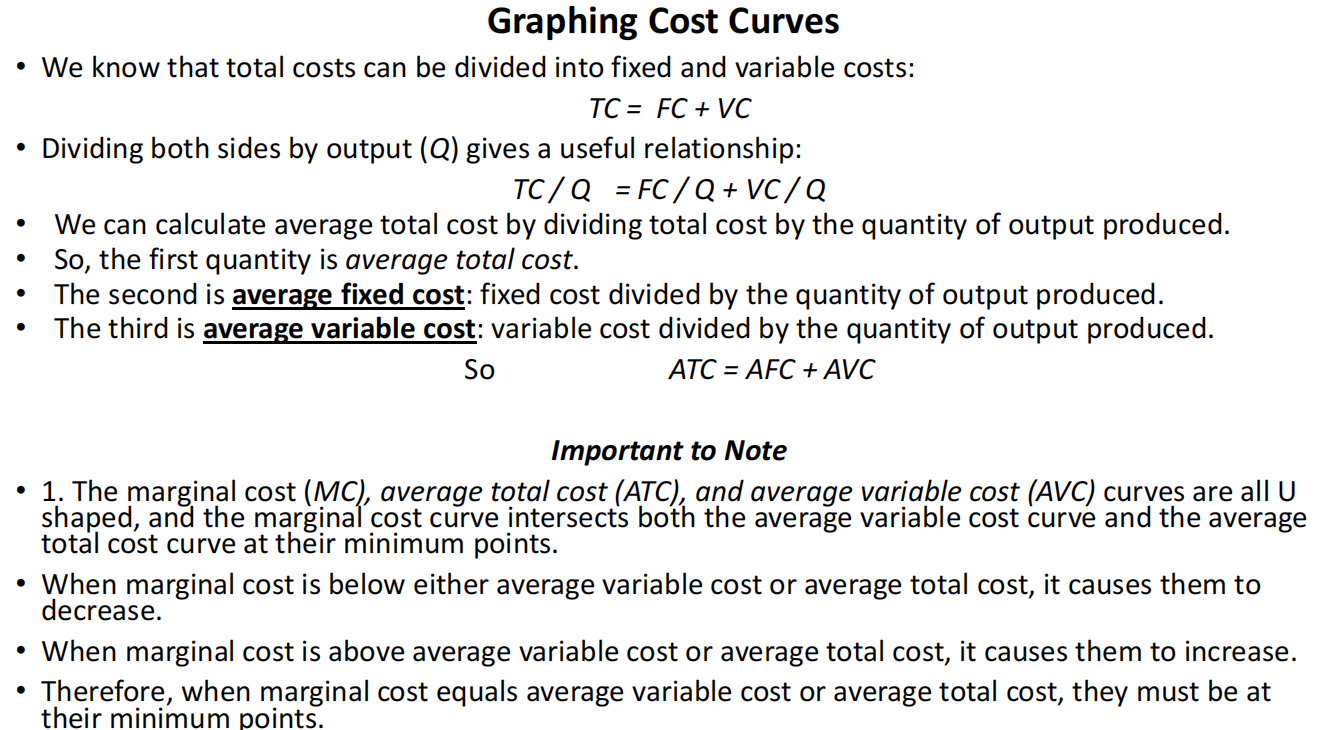
We know that total costs can be divided into fixed and variable costs:
📖 点击查看译文
我们知道总成本可以分为固定成本和变动成本:
TC = FC + VC
📖 点击查看译文
TC = FC + VC
Dividing both sides by output (Q) gives a useful relationship:
📖 点击查看译文
将两边除以产量(Q)得到一个有用的关系:
TC / Q = FC / Q + VC / Q
📖 点击查看译文
TC / Q = FC / Q + VC / Q
We can calculate average total cost by dividing total cost by the quantity of output produced.
📖 点击查看译文
我们可以通过将总成本除以生产的产量来计算平均总成本。
So, the first quantity is average total cost.
📖 点击查看译文
所以,第一个数量是平均总成本。
The second is average fixed cost: fixed cost divided by the quantity of output produced.
📖 点击查看译文
第二个是平均固定成本:固定成本除以生产的产量。
The third is average variable cost: variable cost divided by the quantity of output produced.
📖 点击查看译文
第三个是平均变动成本:变动成本除以生产的产量。
So ATC = AFC + AVC
📖 点击查看译文
所以 ATC = AFC + AVC
Important to Note (需要注意的重要事项)
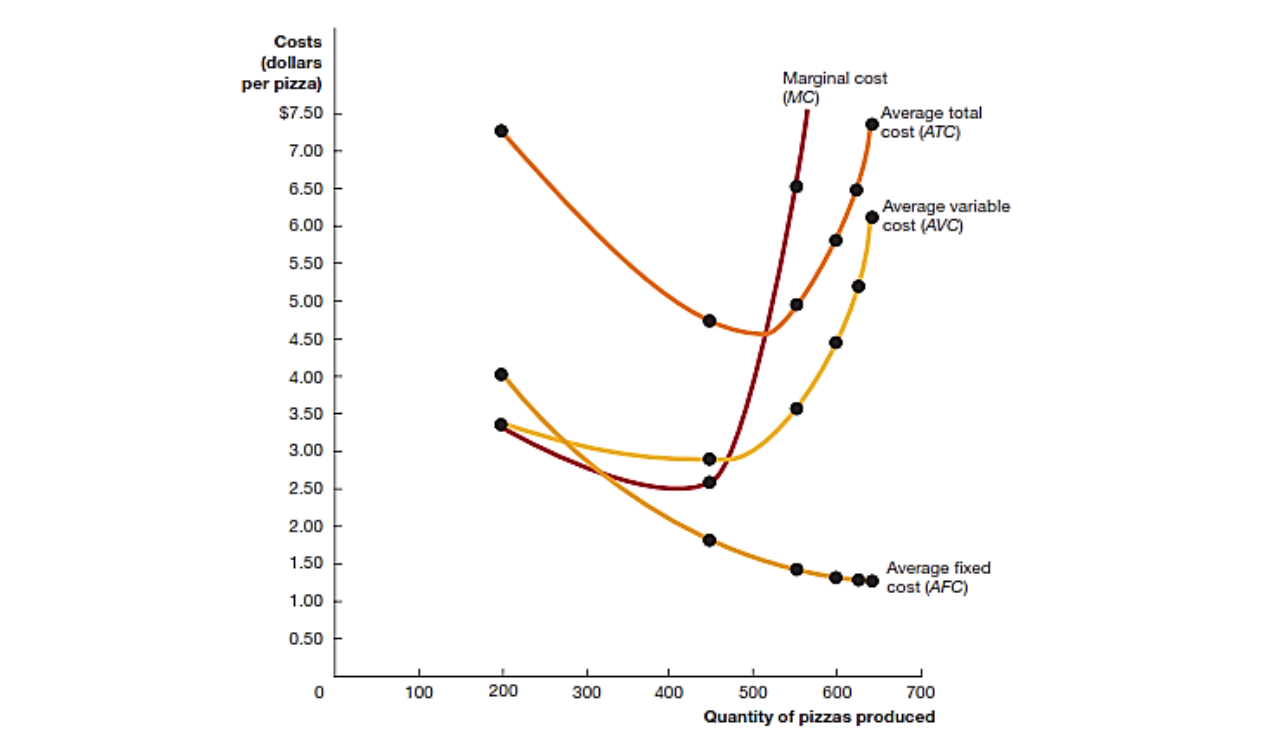
1. The marginal cost (MC), average total cost (ATC), and average variable cost (AVC) curves are all U shaped, and the marginal cost curve intersects both the average variable cost curve and the average total cost curve at their minimum points.
📖 点击查看译文
1. 边际成本(MC)、平均总成本(ATC)和平均变动成本(AVC)曲线都是U形的,并且边际成本曲线在其最低点与平均变动成本曲线和平均总成本曲线相交。
2. When marginal cost is below either average variable cost or average total cost, it causes them to decrease.
📖 点击查看译文
2. 当边际成本低于平均变动成本或平均总成本时,它会导致它们下降。
3. When marginal cost is above average variable cost or average total cost, it causes them to increase.
📖 点击查看译文
3. 当边际成本高于平均变动成本或平均总成本时,它会导致它们上升。
4. Therefore, when marginal cost equals average variable cost or average total cost, they must be at their minimum points.
📖 点击查看译文
4. 因此,当边际成本等于平均变动成本或平均总成本时,它们必须处于最低点。
知识点列表与拓展 (Knowledge Points and Extensions):
1. Cost Curves (成本曲线)
-
解释 (Explanation):
Marginal cost, average total cost, and average variable cost curves all exhibit a U-shape, reflecting diminishing returns and the relationship between costs at different levels of output.
(边际成本、平均总成本和平均变动成本曲线都呈U形,反映了递减收益和不同产量水平下成本之间的关系。)
-
例子 (Example):
For a bakery, the marginal cost of producing one more loaf of bread may first decrease due to specialization, but after a certain point, it will rise as resources become limited.
(对于一家面包店,生产一块面包的边际成本可能首先下降,因为专业化,但在一定点之后,由于资源有限,成本将上升。)
-
拓展 (Extension):
Understanding the relationship between these cost curves helps businesses optimize their production to minimize costs and maximize profits.
(理解这些成本曲线之间的关系有助于企业优化生产,以最小化成本并最大化利润。)
2. Average Total Cost and Average Variable Cost (平均总成本与平均变动成本)
-
解释 (Explanation):
The average total cost is the total cost per unit of output, and the average variable cost is the variable cost per unit of output. These costs are integral to decision-making in production.
(平均总成本是每单位产出的总成本,平均变动成本是每单位产出的变动成本。这些成本对于生产决策至关重要。)
-
例子 (Example):
If the total fixed cost of a factory is 5, with 20 units produced, the average variable cost is $5, while the average total cost will include both fixed and variable costs.
(如果一个工厂的固定成本是100美元,单位变动成本是5美元,生产20个单位,则平均变动成本是5美元,而平均总成本将包括固定成本和变动成本。)
-
拓展 (Extension):
By analyzing these curves, firms can determine the most cost-effective production levels and adjust operations accordingly.
(通过分析这些曲线,企业可以确定最具成本效益的生产水平,并相应调整操作。)
9
Important Notes (重要说明)
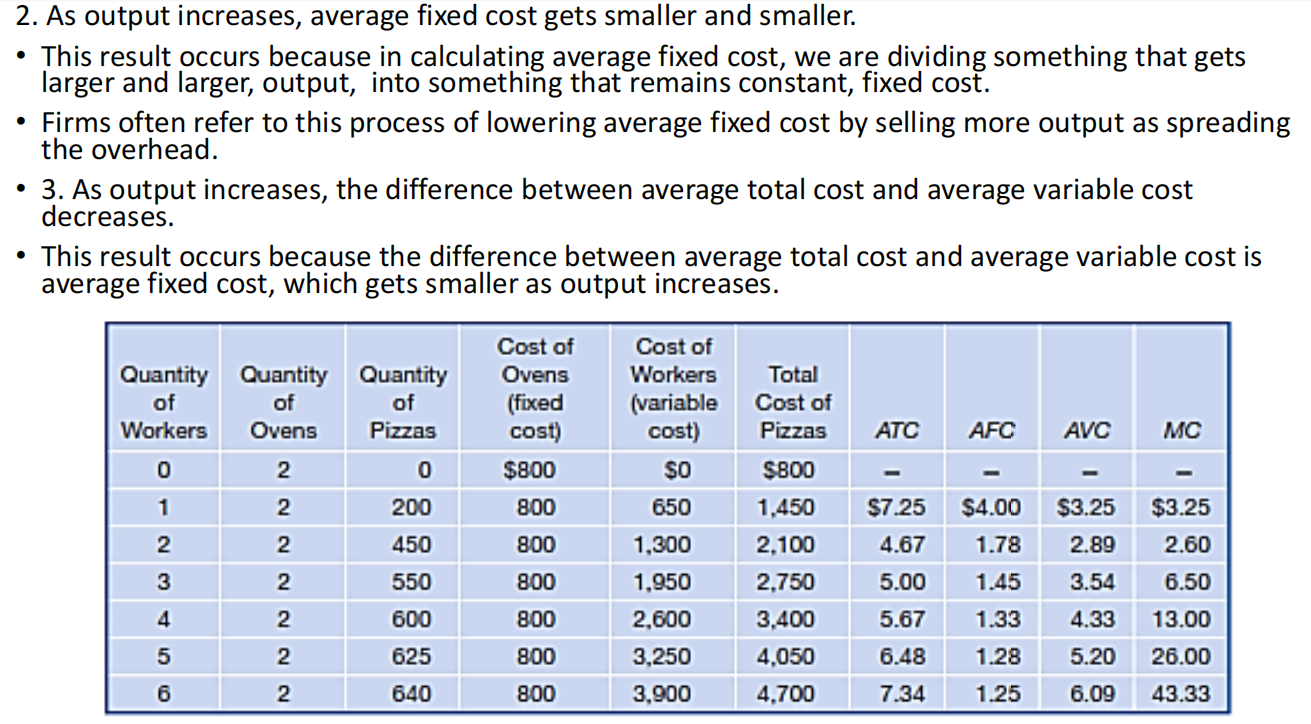
2. As output increases, average fixed cost gets smaller and smaller.
📖 点击查看译文
2. 随着产量的增加,平均固定成本越来越小。
This result occurs because in calculating average fixed cost, we are dividing something that gets larger and larger, output, into something that remains constant, fixed cost.
📖 点击查看译文
这一结果的产生是因为在计算平均固定成本时,我们将不断增加的产量除以保持不变的固定成本。
Firms often refer to this process of lowering average fixed cost by selling more output as spreading the overhead.
📖 点击查看译文
企业通常将通过销售更多产出降低平均固定成本的过程称为分摊间接费用。
3. As output increases, the difference between average total cost and average variable cost decreases.
📖 点击查看译文
3. 随着产量的增加,平均总成本和平均变动成本之间的差距减少。
This result occurs because the difference between average total cost and average variable cost is average fixed cost, which gets smaller as output increases.
📖 点击查看译文
这一结果的产生是因为平均总成本和平均变动成本之间的差距是平均固定成本,而平均固定成本随着产量的增加而减小。
知识点列表与拓展 (Knowledge Points and Extensions):
1. Average Fixed Cost and Output (平均固定成本与产量)
-
解释 (Explanation):
As production increases, the average fixed cost decreases because fixed costs are spread across more units of output.
(随着生产增加,平均固定成本减少,因为固定成本被分摊到更多的产出单位上。)
-
例子 (Example):
A company that pays $1000 per month in rent will have a much lower average fixed cost per unit if it produces 100 units compared to producing just 10 units.
(一家每月支付1000美元租金的公司,如果生产100个单位,平均固定成本将比仅生产10个单位时要低得多。)
-
拓展 (Extension):
Understanding how average fixed cost decreases with output is crucial for businesses looking to optimize production levels and manage overhead costs efficiently.
(理解平均固定成本如何随着产量减少对企业优化生产水平和高效管理间接费用至关重要。)
2. Average Total Cost and Average Variable Cost (平均总成本与平均变动成本)
-
解释 (Explanation):
As output rises, the gap between average total cost and average variable cost decreases because fixed costs are spread over a larger number of units.
(随着产量上升,平均总成本和平均变动成本之间的差距减小,因为固定成本被分摊到更多单位的产出中。)
-
例子 (Example):
A company that produces 100 units has an average total cost that is closer to its average variable cost compared to when it produces just 10 units.
(一家生产100个单位的公司,其平均总成本与平均变动成本更接近,而不是生产仅10个单位时。)
-
拓展 (Extension):
Businesses can use this concept to understand how much of their total cost is due to fixed costs versus variable costs, and make more informed decisions about pricing and output levels.
(企业可以利用这一概念理解其总成本中有多少是由固定成本和变动成本构成的,并就定价和产量水平做出更明智的决策。)
10
11
Costs in the Long Run (长期成本)
Learning Objective: Understand how firms use the long-run average cost curve in their planning.
📖 点击查看译文
学习目标:理解企业如何在规划中使用长期平均成本曲线。
Recall that the long run is a sufficiently long period of time that all costs are variable.
📖 点击查看译文
回顾一下,长期是指一个足够长的时期,在这个时期内所有成本都是可变的。
So in the long run, there is no distinction between fixed and variable costs.
📖 点击查看译文
因此,在长期中,固定成本和变动成本之间没有区别。
For example, in the short run, Jill Johnson has fixed costs of $800 per week because she signed a loan agreement with a bank when she bought her pizza ovens.
📖 点击查看译文
例如,在短期内,Jill Johnson每周有800美元的固定成本,因为她在购买比萨饼烤箱时与银行签署了贷款协议。
But in the long run, the cost of buying more pizza ovens becomes variable because Jill can choose whether to expand her business by buying more of them.
📖 点击查看译文
但在长期内,购买更多比萨饼烤箱的成本变成了可变成本,因为Jill可以选择是否通过购买更多烤箱来扩大她的业务。
Once a company has purchased a fire insurance policy, the cost of the policy is fixed.
📖 点击查看译文
一旦公司购买了火灾保险单,保险费就是固定成本。
But when the policy expires, the company must decide whether to renew it, and the cost becomes variable.
📖 点击查看译文
但当保险单到期时,公司必须决定是否续保,费用变成了可变成本。
The important point is: In the long run, all costs are variable.
📖 点击查看译文
关键点是:在长期内,所有成本都是可变的。
There are no fixed costs in the long run.
📖 点击查看译文
在长期内没有固定成本。
In other words, in the long run, total cost equals variable cost, and average total cost equals average variable cost.
📖 点击查看译文
换句话说,在长期内,总成本等于可变成本,平均总成本等于平均变动成本。
知识点列表与拓展 (Knowledge Points and Extensions):
1. Long-Run Costs (长期成本)
-
解释 (Explanation):
In the long run, all costs become variable because firms can adjust all inputs, such as labor, capital, and equipment.
(在长期内,所有成本都变为可变成本,因为企业可以调整所有投入,如劳动力、资本和设备。)
-
例子 (Example):
A firm that initially has fixed costs for equipment and building rental can decide to buy new equipment or expand production capacity in the long run, turning those costs into variable costs.
(一开始有设备和建筑租赁固定成本的公司,在长期内可以决定购买新设备或扩大生产能力,将这些成本转化为可变成本。)
-
拓展 (Extension):
The long-run cost structure helps firms make decisions about investment, expansion, and scaling based on their ability to adjust all factors of production.
(长期成本结构帮助企业根据调整所有生产要素的能力做出投资、扩张和规模化决策。)
2. Fixed and Variable Costs in the Short Run vs. Long Run (短期与长期的固定成本与可变成本)
-
解释 (Explanation):
In the short run, firms have fixed costs, but in the long run, these costs become variable as firms can adjust their production processes and resources.
(在短期内,企业有固定成本,但在长期内,这些成本变为可变成本,因为企业可以调整生产过程和资源。)
-
例子 (Example):
A restaurant may have fixed costs in the short run for rent and utilities, but in the long run, it can choose to relocate or change its capacity, making these costs variable.
(餐厅在短期内可能有租金和水电费等固定成本,但在长期内,它可以选择搬迁或改变生产能力,使这些成本变为可变成本。)
-
拓展 (Extension):
This distinction is important for firms to understand when making long-term investment decisions, especially when considering factors like expansion and entering new markets.
(这一区别对于企业做出长期投资决策时尤其重要,特别是在考虑扩张和进入新市场等因素时。)
12
Economies of Scale (规模经济)
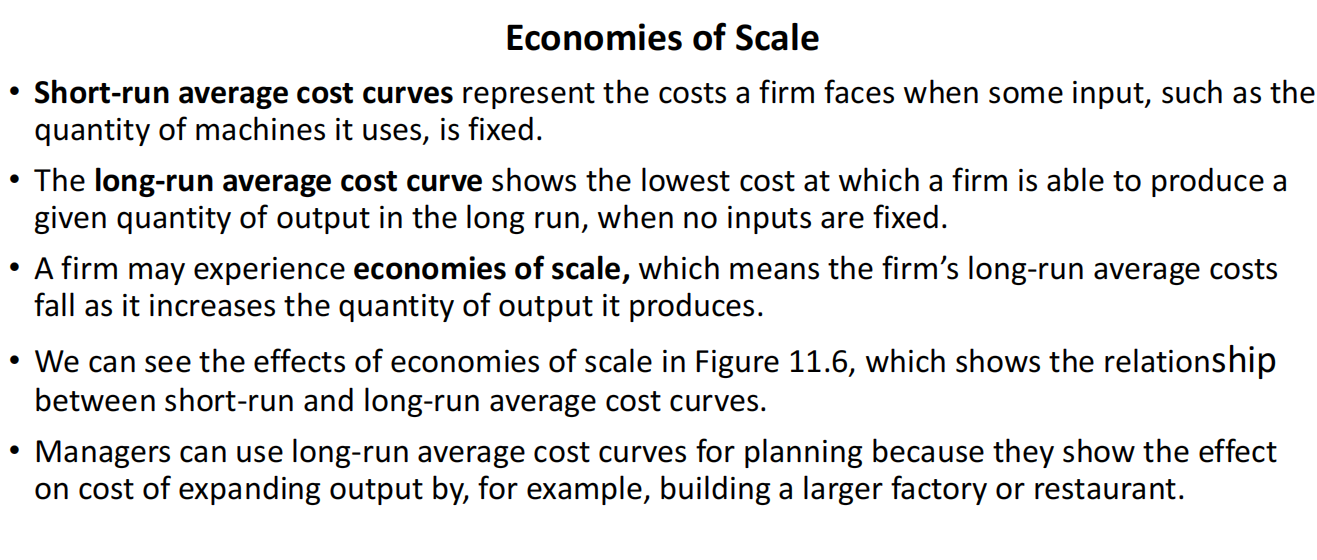
Short-run average cost curves represent the costs a firm faces when some input, such as the quantity of machines it uses, is fixed.
📖 点击查看译文
短期平均成本曲线代表了企业在某些投入(例如使用的机器数量)固定时所面临的成本。
The long-run average cost curve shows the lowest cost at which a firm is able to produce a given quantity of output in the long run, when no inputs are fixed.
📖 点击查看译文
长期平均成本曲线显示了企业在长期内能够以最低成本生产给定数量产出的成本,当所有投入都不固定时。
A firm may experience economies of scale, which means the firm’s long-run average costs fall as it increases the quantity of output it produces.
📖 点击查看译文
企业可能会经历规模经济,这意味着随着生产量的增加,企业的长期平均成本下降。
We can see the effects of economies of scale in Figure 11.6, which shows the relationship between short-run and long-run average cost curves.
📖 点击查看译文
我们可以在图11.6中看到规模经济的效果,该图展示了短期和长期平均成本曲线之间的关系。
Managers can use long-run average cost curves for planning because they show the effect on cost of expanding output by, for example, building a larger factory or restaurant.
📖 点击查看译文
管理者可以使用长期平均成本曲线进行规划,因为它们显示了通过扩大产量(例如建造更大的工厂或餐厅)对成本的影响。
知识点列表与拓展 (Knowledge Points and Extensions):
1. Economies of Scale (规模经济)
-
解释 (Explanation):
Economies of scale refer to the reduction in per-unit costs as a firm increases its output, due to more efficient utilization of resources.
(规模经济是指随着企业增加产量,单位成本下降,因为资源的利用更加高效。)
-
例子 (Example):
A factory producing bicycles might experience economies of scale by producing more bikes, reducing the cost per bike due to bulk purchasing of materials and more efficient machinery usage.
(生产自行车的工厂可能通过增加自行车的生产数量来实现规模经济,由于批量采购原材料和更高效的机器使用,单位自行车的成本降低。)
-
拓展 (Extension):
Understanding economies of scale helps firms make decisions about expansion, such as whether to build new facilities or increase production capacity.
(理解规模经济有助于企业做出扩张决策,例如是否建设新设施或增加生产能力。)
2. Short-Run vs. Long-Run Cost Curves (短期与长期成本曲线)
-
解释 (Explanation):
In the short run, firms face fixed inputs, leading to a U-shaped short-run average cost curve. In the long run, firms can vary all inputs, which leads to the long-run average cost curve, which may show declining costs as output increases.
(在短期内,企业面临固定投入,导致短期平均成本曲线呈U形。在长期内,企业可以调整所有投入,从而导致长期平均成本曲线,随着产量增加,成本可能下降。)
-
例子 (Example):
A restaurant may have fixed costs such as rent and utilities in the short run, but in the long run, it can expand or open new locations, allowing the business to spread its fixed costs over a larger output, thus reducing the average cost per meal.
(餐厅在短期内可能有固定的租金和水电费等成本,但在长期内,它可以扩展或开设新地点,从而使企业能够将固定成本分摊到更大的产量上,从而降低每餐的平均成本。)
-
拓展 (Extension):
The long-run average cost curve is essential for firms when making strategic decisions about capacity and market entry or exit.
(长期平均成本曲线对于企业在做出有关产能和市场进出决策时至关重要。)
3. Application of Long-Run Average Cost Curve (长期平均成本曲线的应用)
-
解释 (Explanation):
Managers use long-run average cost curves to determine the optimal scale of operations and guide long-term investment decisions.
(管理者使用长期平均成本曲线来确定最佳运营规模,并指导长期投资决策。)
-
例子 (Example):
A company looking to expand production may use the long-run average cost curve to decide whether it should invest in building a new facility or increase capacity at its existing plant.
(一家想要扩大生产的公司可能会使用长期平均成本曲线来决定是否应投资建设新设施或增加现有工厂的产能。)
-
拓展 (Extension):
The long-run average cost curve is influenced by factors like technology, economies of scale, and managerial efficiency, which all play a role in shaping long-term cost structures.
(长期平均成本曲线受到技术、规模经济和管理效率等因素的影响,这些因素在塑造长期成本结构中起着重要作用。)
13
Long-Run Average Cost Curves for Automobile Factories (汽车工厂的长期平均成本曲线)
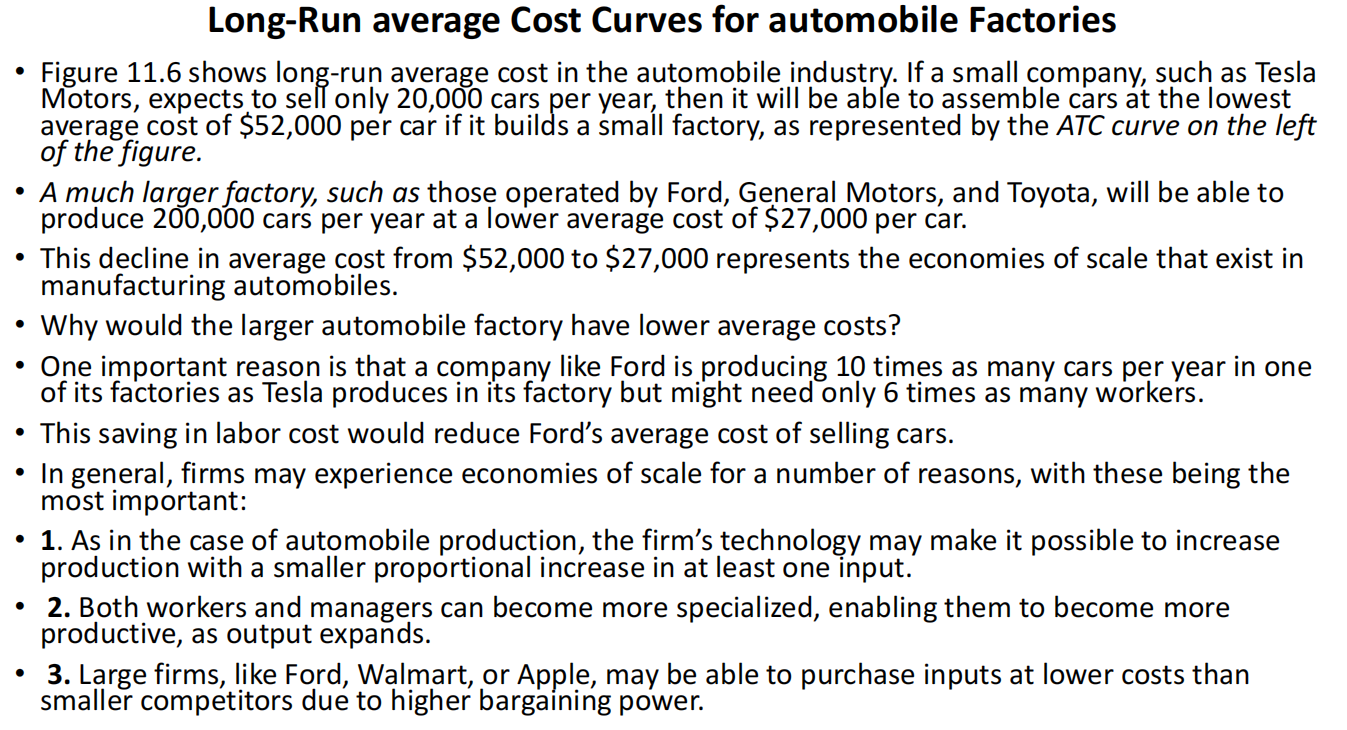
Figure 11.6 shows long-run average cost in the automobile industry. If a small company, such as Tesla Motors, expects to sell only 20,000 cars per year, then it will be able to assemble cars at the lowest average cost of $52,000 per car if it builds a small factory, as represented by the ATC curve on the left of the figure.
📖 点击查看译文
图11.6展示了汽车行业的长期平均成本。如果像特斯拉这样的公司预计每年只卖2万辆车,那么如果它建造一个小型工厂,它将能够以每辆车52,000美元的最低平均成本来组装汽车,正如图中左侧的ATC曲线所表示。
A much larger factory, such as those operated by Ford, General Motors, and Toyota, will be able to produce 200,000 cars per year at a lower average cost of $27,000 per car.
📖 点击查看译文
像福特、通用和丰田这样的更大型工厂,每年能够生产20万辆车,每辆车的平均成本为27,000美元,低于小型工厂。
This decline in average cost from 27,000 represents the economies of scale that exist in manufacturing automobiles.
📖 点击查看译文
从52,000美元到27,000美元的平均成本下降代表了汽车制造中的规模经济。
Why would the larger automobile factory have lower average costs?
📖 点击查看译文
为什么更大的汽车工厂会有更低的平均成本?
One important reason is that a company like Ford is producing 10 times as many cars per year in one of its factories as Tesla produces in its factory but might need only 6 times as many workers. This saving in labor cost would reduce Ford’s average cost of selling cars.
📖 点击查看译文
一个重要原因是,像福特这样的公司每年在一个工厂生产的汽车是特斯拉工厂的10倍,但可能只需要6倍的工人。这种劳动力成本的节省将降低福特的汽车销售平均成本。
In general, firms may experience economies of scale for a number of reasons, with these being the most important:
📖 点击查看译文
一般来说,企业可能会由于多种原因经历规模经济,其中最重要的原因如下:
- As in the case of automobile production, the firm’s technology may make it possible to increase production with a smaller proportional increase in at least one input.
📖 点击查看译文
与汽车生产的情况类似,公司的技术可能使得生产能够在至少一个投入上以较小的比例增加生产。
- Both workers and managers can become more specialized, enabling them to become more productive, as output expands.
📖 点击查看译文
随着产出的扩展,工人和管理者可以变得更加专业化,从而提高生产力。
- Large firms, like Ford, Walmart, or Apple, may be able to purchase inputs at lower costs than smaller competitors due to higher bargaining power.
📖 点击查看译文
像福特、沃尔玛或苹果这样的大型公司,可能由于更高的议价能力,能够以比小型竞争对手更低的成本购买投入品。
知识点列表与拓展 (Knowledge Points and Extensions):
1. Economies of Scale in Automobile Manufacturing (汽车制造中的规模经济)
-
解释 (Explanation):
Economies of scale in the automobile industry allow larger firms to reduce per-unit costs by increasing production. This can be attributed to factors such as more efficient use of labor, technology improvements, and bulk purchasing.
(汽车行业中的规模经济使得更大的企业通过增加生产来降低单位成本。这可以归因于劳动力利用效率提高、技术改进和批量采购等因素。)
-
例子 (Example):
A large car manufacturer like Toyota can produce cars at a lower average cost per unit compared to a smaller company like Tesla due to its ability to spread fixed costs over more units and utilize resources more efficiently.
(像丰田这样的大型汽车制造商能够比特斯拉这样的小公司以更低的单位成本生产汽车,因为它能够将固定成本分摊到更多的单位上,并更高效地利用资源。)
-
拓展 (Extension):
Understanding economies of scale is vital for companies when deciding whether to expand production capacity or enter new markets, as it influences pricing strategies and profitability.
(理解规模经济对于公司决定是否扩展生产能力或进入新市场至关重要,因为它影响定价策略和盈利能力。)
2. Specialization and Division of Labor (专业化与劳动分工)
-
解释 (Explanation):
As firms grow, workers and managers can specialize in specific tasks, leading to greater efficiency and productivity.
(随着企业的增长,工人和管理者可以在特定任务上进行专业化,从而提高效率和生产力。)
-
例子 (Example):
In large firms like Ford, managers and workers can specialize in their areas of expertise, which makes them more productive than in smaller companies where workers might perform a variety of tasks.
(在像福特这样的大型公司中,管理者和工人可以在各自的专业领域进行专业化,从而比在小公司中从事多种任务的工人更具生产力。)
-
拓展 (Extension):
Specialization is a key factor in the growth of large firms and the realization of economies of scale. As production volume increases, workers can focus on specific tasks, improving overall productivity.
(专业化是大型公司增长和实现规模经济的关键因素。随着生产量的增加,工人可以专注于特定任务,从而提高整体生产力。)
3. Bargaining Power and Bulk Purchasing (议价能力与批量采购)
-
解释 (Explanation):
Larger firms have greater bargaining power, which allows them to purchase inputs in bulk at a lower cost, contributing to lower average costs.
(大型企业拥有更强的议价能力,这使得它们能够以更低的成本批量采购投入品,从而降低平均成本。)
-
例子 (Example):
Large retailers like Walmart can negotiate lower prices with suppliers for bulk purchases of goods, giving them a cost advantage over smaller competitors.
(像沃尔玛这样的零售巨头可以与供应商谈判,获得批量购买商品的更低价格,从而在成本上占据优势。)
-
拓展 (Extension):
Bargaining power is an essential tool for large firms, not only in reducing input costs but also in negotiating favorable terms for logistics, marketing, and other operational aspects.
(议价能力是大型公司的一项重要工具,不仅可以降低投入成本,还能在物流、营销和其他运营方面谈判获得有利条款。)
14
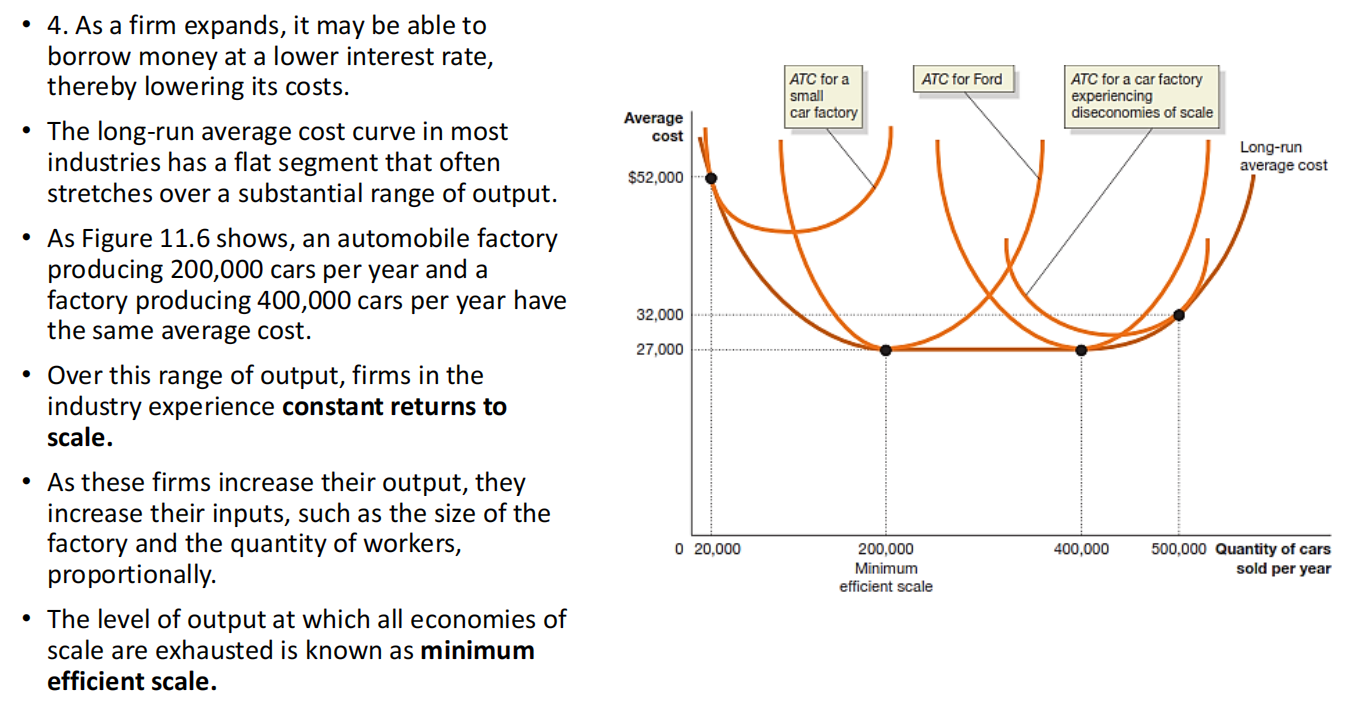
4. As a firm expands, it may be able to borrow money at a lower interest rate, thereby lowering its costs. (随着企业扩张,它可能能够以更低的利率借款,从而降低其成本)
The long-run average cost curve in most industries has a flat segment that often stretches over a substantial range of output.
📖 点击查看译文
大多数行业的长期平均成本曲线都有一个平坦的部分,通常覆盖较大范围的产量。
As Figure 11.6 shows, an automobile factory producing 200,000 cars per year and a factory producing 400,000 cars per year have the same average cost.
📖 点击查看译文
如图11.6所示,每年生产20万辆汽车的汽车工厂与生产40万辆汽车的工厂具有相同的平均成本。
Over this range of output, firms in the industry experience constant returns to scale.
📖 点击查看译文
在这一产量范围内,行业内的企业经历了规模报酬不变的情况。
As these firms increase their output, they increase their inputs, such as the size of the factory and the quantity of workers, proportionally.
📖 点击查看译文
随着这些公司增加产量,它们也按比例增加投入,如工厂规模和工人数量。
The level of output at which all economies of scale are exhausted is known as minimum efficient scale.
📖 点击查看译文
当所有规模经济都被消耗完毕时的产量水平被称为最小有效规模。
知识点列表与拓展 (Knowledge Points and Extensions):
1. Borrowing at Lower Interest Rates (以较低利率借款)
-
解释 (Explanation):
As firms expand, they may gain access to better financing options, including borrowing at lower interest rates. This can lower their overall costs by reducing the interest expenses on loans.
(随着企业的扩张,它们可能能够获得更好的融资选择,包括以更低的利率借款。这可以通过减少贷款的利息支出来降低企业的整体成本。)
-
例子 (Example):
A large firm like Walmart can borrow money at a lower interest rate than a smaller competitor due to its higher creditworthiness and market presence.
(像沃尔玛这样的大型公司,由于更高的信用度和市场影响力,可以以更低的利率借款,而小型竞争者则不具备此优势。)
-
拓展 (Extension):
Firms can further reduce their costs by using the saved interest to invest in more efficient technology, research, or infrastructure that enhances productivity.
(企业可以通过将节省下来的利息用于投资更高效的技术、研究或基础设施来进一步降低成本,提升生产力。)
2. Constant Returns to Scale (规模报酬不变)
-
解释 (Explanation):
In the range of output where firms experience constant returns to scale, increasing all inputs by a certain proportion leads to an equal proportional increase in output.
(在企业经历规模报酬不变的产量范围内,按一定比例增加所有投入将导致产量按相同比例增加。)
-
例子 (Example):
A factory that doubles its size by adding more workers and machinery can double its output, thus maintaining the same average cost per unit of production.
(一个通过增加更多工人和机器来将工厂规模翻倍的工厂可以将产量翻倍,从而保持每单位生产的相同平均成本。)
-
拓展 (Extension):
Constant returns to scale are significant for firms when they reach an optimal level of output, as they can maintain low per-unit costs while scaling production without experiencing inefficiencies.
(规模报酬不变对企业在达到最佳产出水平时至关重要,因为它们可以在扩大生产的同时保持低单位成本,而不会出现效率低下的问题。)
3. Minimum Efficient Scale (最小有效规模)
-
解释 (Explanation):
The minimum efficient scale is the point at which a firm has exhausted all economies of scale, and any further increases in production do not lower average costs.
(最小有效规模是企业已耗尽所有规模经济的点,任何进一步增加生产都不会降低平均成本。)
-
例子 (Example):
A firm in the automobile industry may reach the minimum efficient scale when it can produce 100,000 cars per year, after which increasing output no longer results in lower costs per car.
(一家汽车行业的公司可能在每年生产10万辆汽车时达到最小有效规模,此后增加产量将不再导致每辆车成本的降低。)
-
拓展 (Extension):
Firms that do not reach the minimum efficient scale may struggle to compete in terms of costs, as they cannot fully exploit economies of scale to reduce their average costs.
(未能达到最小有效规模的公司可能在成本方面难以竞争,因为它们无法充分利用规模经济来降低平均成本。)
15
An automobile factory producing 200,000 cars per year has reached minimum efficient scale.
📖 点击查看译文
每年生产20万辆汽车的工厂已达到最小有效规模。
Firms that produce at less than minimum efficient scale may have difficulty surviving because they will be producing output at higher cost than competitors.
📖 点击查看译文
生产低于最小有效规模的公司可能难以生存,因为它们的生产成本高于竞争对手。
Very large automobile factories experience increasing average costs as managers begin to have difficulty coordinating the operation of the factory.
📖 点击查看译文
非常大的汽车工厂在管理者开始难以协调工厂运营时,会经历平均成本上升。
Figure 11.6 shows that for production above 400,000 cars per year, firms in the industry experience diseconomies of scale.
📖 点击查看译文
图11.6显示,每年生产超过40万辆汽车的公司在行业中会经历规模不经济。
For instance, Toyota found that as it expanded production at its Georgetown, Kentucky, plant and its plants in China, its managers had difficulty keeping average cost from rising.
📖 点击查看译文
例如,丰田发现,在其肯塔基州乔治敦工厂和中国工厂扩张生产时,管理者难以控制平均成本不上涨。
One analysis of the problems Toyota faced in expanding production concluded: “It is the kind of paradox many highly successful companies face: Getting bigger doesn’t always mean getting better.”
📖 点击查看译文
对丰田扩张生产问题的分析得出结论:“这是许多非常成功的公司面临的悖论:变大不一定意味着变好。”
知识点列表与拓展 (Knowledge Points and Extensions):
1. Minimum Efficient Scale (最小有效规模)
-
解释 (Explanation):
The minimum efficient scale is the output level where a firm experiences the lowest average cost. Firms below this level face higher costs than competitors.
(最小有效规模是企业经历最低平均成本的产出水平。低于此水平的公司面临的成本高于竞争对手。)
-
例子 (Example):
A small factory may produce fewer cars than the minimum efficient scale and thus incur higher costs than larger factories that can exploit economies of scale.
(一个小工厂可能生产的汽车少于最小有效规模,因此会承担比大型工厂更高的成本,而后者可以利用规模经济。)
-
拓展 (Extension):
Firms must carefully assess their scale of production to remain competitive. If they are unable to reach minimum efficient scale, they may struggle to compete on cost efficiency.
(企业必须仔细评估其生产规模以保持竞争力。如果它们无法达到最小有效规模,可能会在成本效率上难以竞争。)
2. Diseconomies of Scale (规模不经济)
-
解释 (Explanation):
Diseconomies of scale occur when a firm’s average costs rise as it increases its output beyond a certain level.
(规模不经济是指当企业的产量超过某一水平时,平均成本上升的情况。)
-
例子 (Example):
Toyota’s experience in expanding its factories beyond a certain capacity led to increasing management complexity and higher costs.
(丰田在其工厂超出某一生产能力后的扩张经历了管理复杂性增加和成本上升的问题。)
-
拓展 (Extension):
Diseconomies of scale may arise due to factors such as increased coordination challenges, bureaucratic inefficiencies, or difficulties in managing a larger workforce.
(规模不经济可能由协调挑战增加、官僚效率低下或管理更大员工队伍的困难等因素引起。)
3. Paradox of Growth (增长的悖论)
-
解释 (Explanation):
The paradox of growth is when increasing the size of a firm does not result in improved performance or efficiency.
(增长的悖论是指扩大企业规模并没有导致表现或效率的提高。)
-
例子 (Example):
Many companies face this paradox, where they may struggle to maintain efficiency and profitability as they grow beyond a certain point.
(许多公司都面临这一悖论,当它们的规模超过某一临界点时,可能会难以保持效率和盈利能力。)
-
拓展 (Extension):
Companies need to manage growth strategically, ensuring that scaling up operations is accompanied by improvements in organizational processes and management practices.
(公司需要战略性地管理增长,确保扩大运营的同时,组织流程和管理实践也得到改进。)
16
17
Appendix: Using Isoquants and Isocost Lines to Understand Production and Cost
📖 点击查看译文
附录:使用等产量曲线和等成本线理解生产和成本
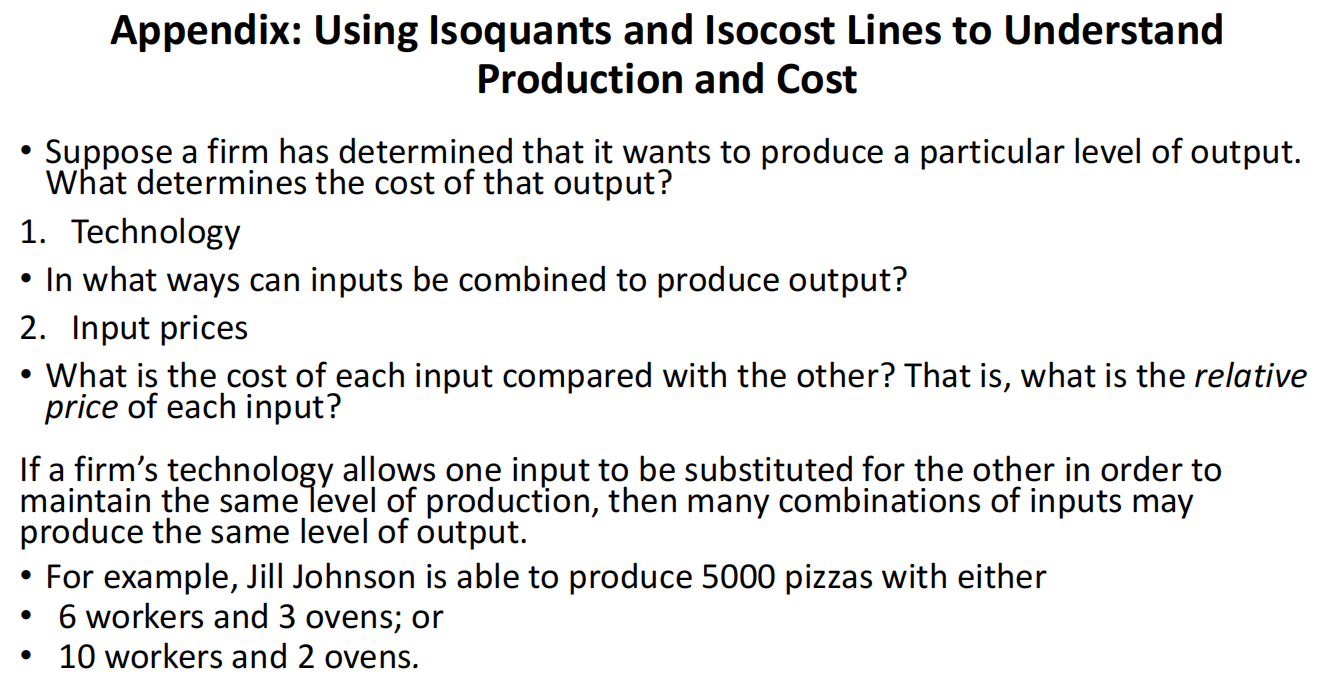
Suppose a firm has determined that it wants to produce a particular level of output. What determines the cost of that output?
📖 点击查看译文
假设一个公司已确定希望生产一定水平的产量。是什么决定了该产量的成本?
1. Technology
📖 点击查看译文
1. 技术
-
In what ways can inputs be combined to produce output?
📖 点击查看译文
以何种方式将投入物组合以生产产出?
2. Input prices
📖 点击查看译文
2. 投入价格
-
What is the cost of each input compared with the other? That is, what is the relative price of each input?
📖 点击查看译文
每种投入物的成本与其他投入物相比如何?也就是说,每种投入物的相对价格是多少?
If a firm’s technology allows one input to be substituted for the other in order to maintain the same level of production, then many combinations of inputs may produce the same level of output.
📖 点击查看译文
如果公司的技术允许将一种投入物替代为另一种,以保持相同的生产水平,那么许多投入物的组合可能会产生相同的产量。
For example, Jill Johnson is able to produce 5000 pizzas with either:
📖 点击查看译文
例如,Jill Johnson能够通过以下两种方式生产5000个披萨:
- 6 workers and 3 ovens
📖 点击查看译文
6个工人和3个烤箱
- 10 workers and 2 ovens
📖 点击查看译文
10个工人和2个烤箱
知识点列表与拓展 (Knowledge Points and Extensions):
1. Isoquants (等产量曲线)
-
解释 (Explanation):
Isoquants show different combinations of inputs that produce the same level of output. They are similar to indifference curves in consumer theory.
(等产量曲线显示生产相同产量的不同投入物组合。它们类似于消费者理论中的无差异曲线。)
-
例子 (Example):
Jill’s production choices of 6 workers and 3 ovens or 10 workers and 2 ovens both allow for the same output level of 5000 pizzas, but they represent different input combinations.
(Jill选择6个工人和3个烤箱或10个工人和2个烤箱都能产生相同的5000个披萨,但它们代表不同的投入物组合。)
-
拓展 (Extension):
Firms can use isoquants to find the most cost-effective combination of inputs. This allows firms to explore trade-offs between different input combinations.
(企业可以使用等产量曲线找到最具成本效益的投入物组合。这使得企业可以探索不同投入物组合之间的权衡。)
2. Isocost Lines (等成本线)
-
解释 (Explanation):
Isocost lines represent the different combinations of inputs that cost the same total amount.
(等成本线表示不同的投入物组合,这些组合的总成本相同。)
-
例子 (Example):
If Jill wants to spend a specific amount on labor and ovens, the isocost line shows all combinations of labor and ovens she can afford within that budget.
(如果Jill希望在劳动力和烤箱上花费特定金额,等成本线将显示她在该预算范围内能够负担的所有劳动力和烤箱的组合。)
-
拓展 (Extension):
Firms use isocost lines to determine which combinations of inputs are affordable given their budget constraints. The optimal combination of inputs lies where the isocost line is tangent to the isoquant.
(企业使用等成本线来确定在其预算限制下哪些投入物组合是负担得起的。最优的投入物组合位于等成本线与等产量曲线相切的地方。)
18
Understanding the Cost-Minimizing Combination of Inputs
📖 点击查看译文
理解成本最小化的投入物组合
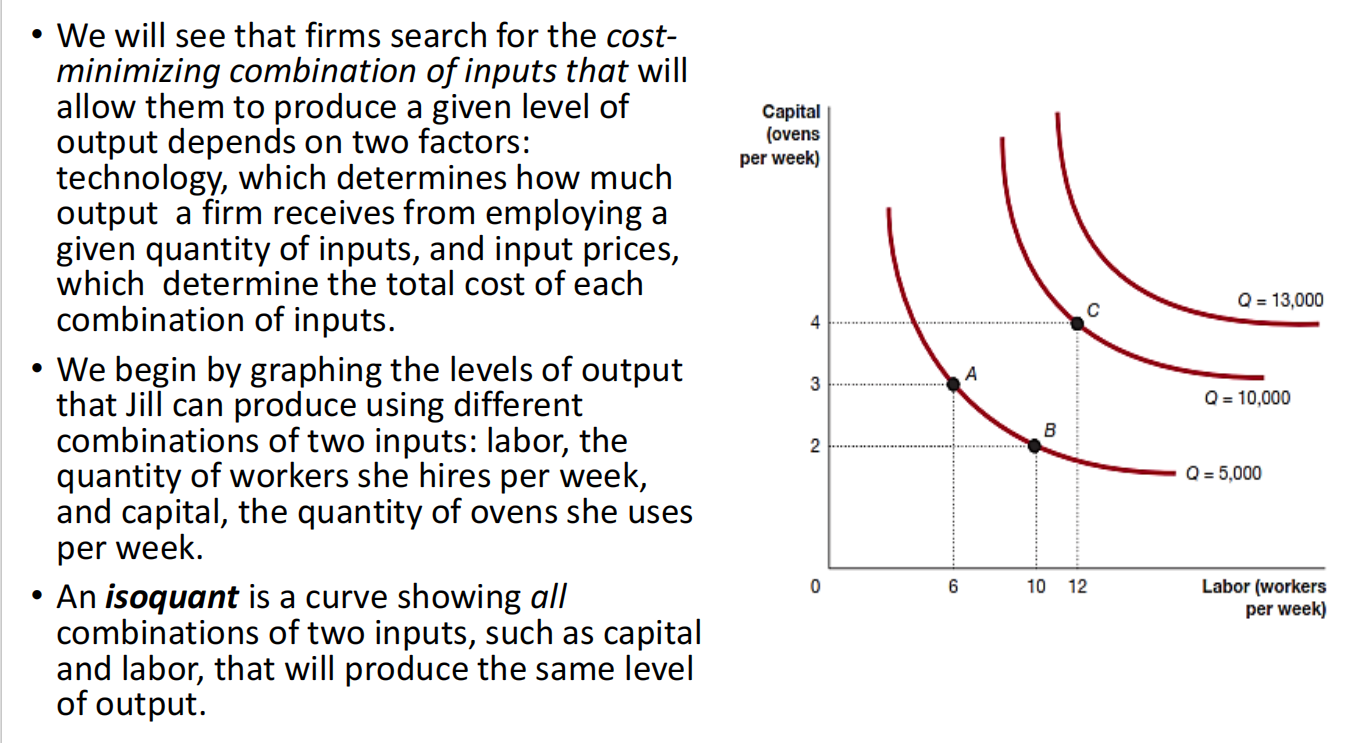
Firms search for the cost-minimizing combination of inputs that will allow them to produce a given level of output. This depends on two factors:
📖 点击查看译文
企业寻求成本最小化的投入物组合,以便生产给定水平的产出。这取决于两个因素:
-
Technology
📖 点击查看译文
技术
-
Technology determines how much output a firm receives from employing a given quantity of inputs.
📖 点击查看译文
技术决定了企业使用给定数量的投入物可以获得多少产出。
-
-
Input Prices
📖 点击查看译文
投入物价格
-
Input prices determine the total cost of each combination of inputs.
📖 点击查看译文
投入物价格决定了每种投入物组合的总成本。
-
Graphing the Output Levels: Jill’s Example
📖 点击查看译文
绘制产出水平:Jill的例子
-
Jill can produce different levels of output using different combinations of two inputs:
-
Labor – The number of workers she hires per week.
-
Capital – The number of ovens she uses per week.
-
Isoquants: A Curve Showing Input Combinations for the Same Output
📖 点击查看译文
等产量曲线:显示生产相同产出的投入物组合的曲线
-
An isoquant is a curve showing all combinations of two inputs, such as capital and labor, that will produce the same level of output.
📖 点击查看译文
等产量曲线是显示所有两种投入物组合(例如资本和劳动)能够生产相同产出水平的曲线。
知识点列表与拓展 (Knowledge Points and Extensions):
1. Isoquants (等产量曲线)
-
解释 (Explanation):
Isoquants are similar to indifference curves in consumer theory, but for production. They show the different input combinations that can produce the same level of output.
(等产量曲线类似于消费者理论中的无差异曲线,但用于生产。它们显示了能生产相同产量的不同投入物组合。)
-
例子 (Example):
Jill could choose different combinations of labor (workers) and capital (ovens) to produce 5000 pizzas, such as 6 workers and 3 ovens or 10 workers and 2 ovens.
(Jill可以选择不同的劳动(工人)和资本(烤箱)组合来生产5000个披萨,例如6个工人和3个烤箱,或10个工人和2个烤箱。)
-
拓展 (Extension):
Firms use isoquants to understand how they can substitute one input for another, or how much of each input is needed to produce a certain output level.
(企业使用等产量曲线来了解如何将一种投入物替代为另一种投入物,或者生产特定产量水平需要多少每种投入物。)
2. Input Substitution (投入物替代)
-
解释 (Explanation):
Firms often substitute one input for another, such as using more labor and fewer ovens or vice versa, depending on the prices of the inputs and the technology available.
(企业通常会将一种投入物替代为另一种,例如根据投入物的价格和可用的技术,使用更多的劳动和更少的烤箱,或者反之。)
-
例子 (Example):
Jill may substitute more workers for ovens if labor is cheaper than capital or if technology allows for increased productivity with more workers.
(如果劳动比资本便宜,或者技术允许通过增加工人提高生产率,Jill可能会将更多的工人替代为烤箱。)
-
拓展 (Extension):
The ability to substitute inputs efficiently depends on the firm’s production technology, which dictates the relationship between the inputs and output.
(有效地替代投入物的能力取决于企业的生产技术,这决定了投入物与产出之间的关系。)
19
Isoquants and Marginal Rate of Technical Substitution (MRTS)
📖 点击查看译文
等产量曲线与技术替代的边际率(MRTS)
More Inputs and Higher Production Levels
📖 点击查看译文
更多的投入物和更高的生产水平
-
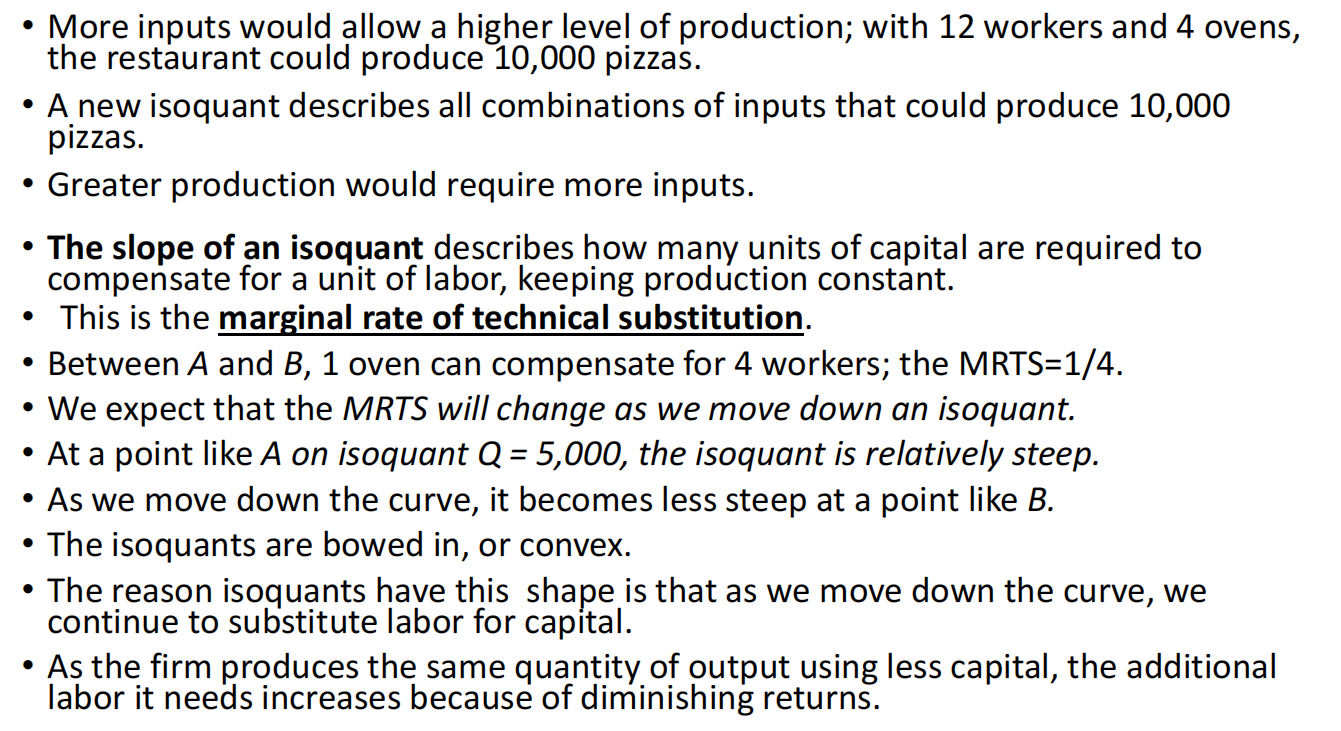
More inputs would allow a higher level of production.
📖 点击查看译文
更多的投入物将允许更高的生产水平。
-
For example, with 12 workers and 4 ovens, Jill’s restaurant could produce 10,000 pizzas.
📖 点击查看译文
例如,使用12个工人和4个烤箱,Jill的餐厅可以生产10,000个披萨。
-
Isoquants for Different Levels of Output
📖 点击查看译文
不同产出水平的等产量曲线
-
A new isoquant describes all combinations of inputs that could produce 10,000 pizzas.
📖 点击查看译文
新的等产量曲线描述了所有能够生产10,000个披萨的投入物组合。
-
Greater production would require more inputs.
📖 点击查看译文
更高的生产水平将需要更多的投入物。
The Marginal Rate of Technical Substitution (MRTS)
📖 点击查看译文
技术替代的边际率(MRTS)
-
The slope of an isoquant describes how many units of capital are required to compensate for a unit of labor, keeping production constant.
📖 点击查看译文
等产量曲线的斜率描述了为了补偿一个单位劳动所需要的资本单位数,以保持生产水平不变。
-
This is known as the Marginal Rate of Technical Substitution (MRTS).
📖 点击查看译文
这被称为技术替代的边际率(MRTS)。
-
For example, between point A and point B, 1 oven can compensate for 4 workers, so the MRTS = 1/4.
📖 点击查看译文
例如,在A点和B点之间,1个烤箱可以补偿4个工人,因此MRTS = 1/4。
Changes in MRTS Along an Isoquant
📖 点击查看译文
沿等产量曲线的MRTS变化
-
We expect the MRTS to change as we move down an isoquant.
📖 点击查看译文
我们预计MRTS会随着沿等产量曲线的移动而发生变化。
-
At a point like A on the isoquant for Q = 5,000, the isoquant is relatively steep.
📖 点击查看译文
例如,在等产量曲线Q = 5,000的A点,等产量曲线相对陡峭。
-
As we move down the curve, the isoquant becomes less steep at a point like B.
📖 点击查看译文
随着沿曲线的下移,等产量曲线在B点变得不那么陡峭。
Convex Shape of Isoquants
📖 点击查看译文
等产量曲线的凸形状
-
Isoquants are bowed in or convex.
📖 点击查看译文
等产量曲线是向内弯曲的,或是凸形的。
-
The reason isoquants have this shape is that as we move down the curve, we continue to substitute labor for capital.
📖 点击查看译文
等产量曲线具有这种形状的原因是,随着沿曲线的下移,我们继续将劳动替代为资本。
-
As the firm produces the same quantity of output using less capital, the additional labor it needs increases due to diminishing returns.
📖 点击查看译文
随着公司使用较少的资本生产相同数量的产出,所需的额外劳动增加,因为收益递减。
知识点列表与拓展 (Knowledge Points and Extensions):
1. Marginal Rate of Technical Substitution (MRTS) (技术替代的边际率)
-
解释 (Explanation):
The MRTS represents how many units of one input are needed to substitute for another input, keeping output constant. It is reflected in the slope of an isoquant.
(MRTS表示为保持产出不变,替代一种投入物所需要的另一种投入物的数量。它反映在等产量曲线的斜率中。)
-
例子 (Example):
If Jill’s restaurant needs 1 oven to replace 4 workers, the MRTS is 1/4.
(如果Jill的餐厅需要1个烤箱来替代4个工人,则MRTS为1/4。)
-
拓展 (Extension):
MRTS can change along an isoquant, reflecting diminishing returns as more labor is substituted for capital.
(MRTS可以沿等产量曲线发生变化,反映出随着更多劳动替代资本,收益递减的现象。)
2. Isoquant Shape (等产量曲线形状)
-
解释 (Explanation):
Isoquants are convex due to diminishing returns as inputs are substituted for one another.
(等产量曲线是凸形的,因为在投入物相互替代的过程中存在收益递减现象。)
-
例子 (Example):
As more labor is substituted for capital, each additional unit of labor is less effective in increasing output.
(随着更多劳动替代资本,每增加一个单位的劳动,对产出的增加效果减弱。)
-
拓展 (Extension):
Firms aim to minimize costs by choosing the optimal combination of inputs along the isoquant.
(企业通过选择沿等产量曲线的最佳投入物组合来最小化成本。)
20
Isocost Lines
📖 点击查看译文
等成本线
Defining Isocost Lines
📖 点击查看译文
定义等成本线
-
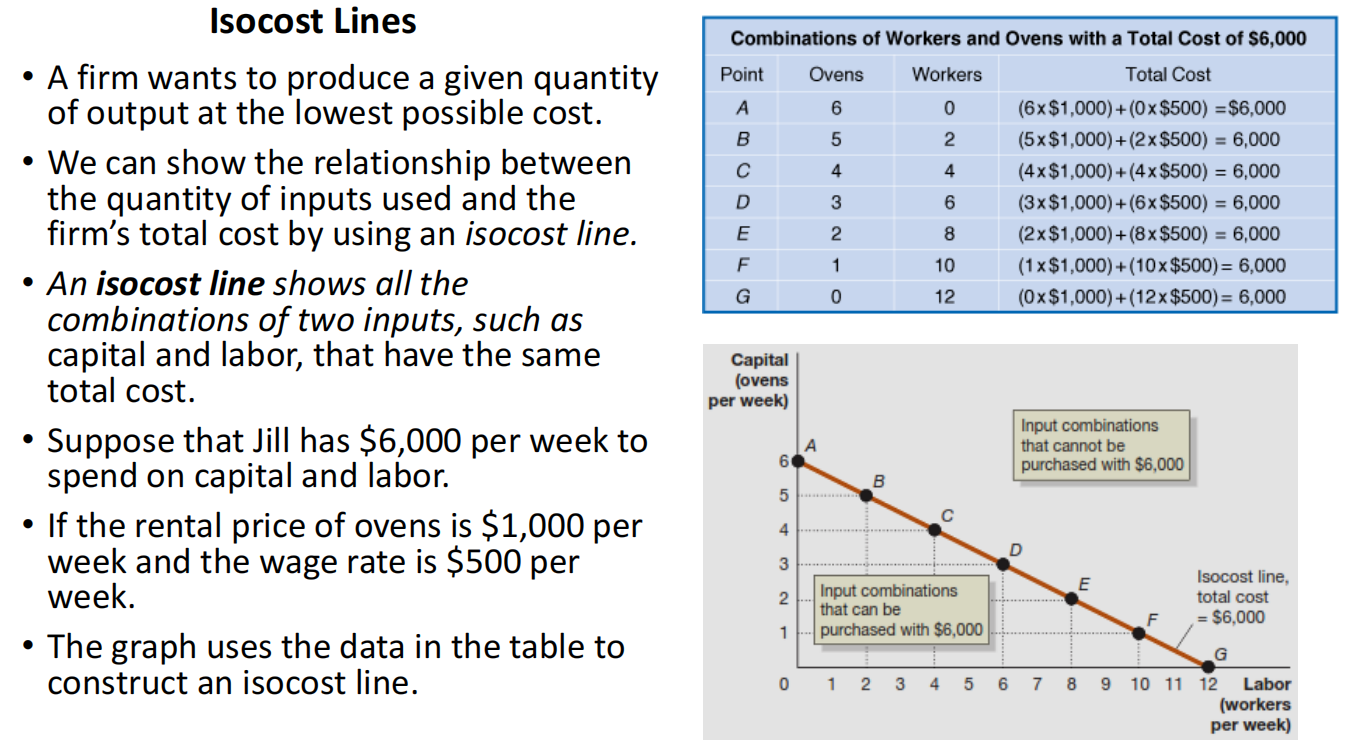
A firm wants to produce a given quantity of output at the lowest possible cost.
📖 点击查看译文
企业希望以最低成本生产一定数量的产出。
-
We can show the relationship between the quantity of inputs used and the firm’s total cost by using an isocost line.
📖 点击查看译文
我们可以通过使用等成本线显示投入物的数量与企业总成本之间的关系。
-
An isocost line shows all the combinations of two inputs, such as capital and labor, that have the same total cost.
📖 点击查看译文
等成本线显示了具有相同总成本的两种投入物组合,例如资本和劳动。
Example of Isocost Line
📖 点击查看译文
等成本线示例
-
Suppose that Jill has $6,000 per week to spend on capital and labor.
📖 点击查看译文
假设Jill每周有6,000美元可以用于购买资本和劳动。
-
If the rental price of ovens is 500 per week, then Jill can choose various combinations of capital and labor to stay within the budget.
📖 点击查看译文
如果烤箱的租金是每周1,000美元,工资率是每周500美元,那么Jill可以选择不同的资本和劳动组合来保持在预算范围内。
-
The graph uses the data in the table to construct an isocost line.
📖 点击查看译文
图表使用表中的数据来构造等成本线。
知识点列表与拓展 (Knowledge Points and Extensions):
1. Isocost Line (等成本线)
-
解释 (Explanation):
An isocost line represents the total cost of different combinations of inputs, where the cost remains constant. It helps to identify the cost-minimizing input combinations for a firm.
(等成本线表示不同投入物组合的总成本,其中成本保持不变。它有助于识别企业的成本最小化投入物组合。)
-
例子 (Example):
With a 1,000 for capital and $500 for labor, Jill can use the isocost line to find all possible input combinations.
(假设Jill每周有6,000美元预算,资本租金为1,000美元,劳动工资为500美元,Jill可以通过等成本线找到所有可能的投入物组合。)
-
拓展 (Extension):
Firms use isocost lines in conjunction with isoquants to identify the least-cost combination of inputs to produce a given level of output.
(企业将等成本线与等产量曲线结合使用,以确定生产给定产出水平的最小成本投入物组合。)
21
Slope of the Isocost Line
📖 点击查看译文
等成本线的斜率
Slope of the Isocost Line Explanation
📖 点击查看译文
等成本线斜率解释
-
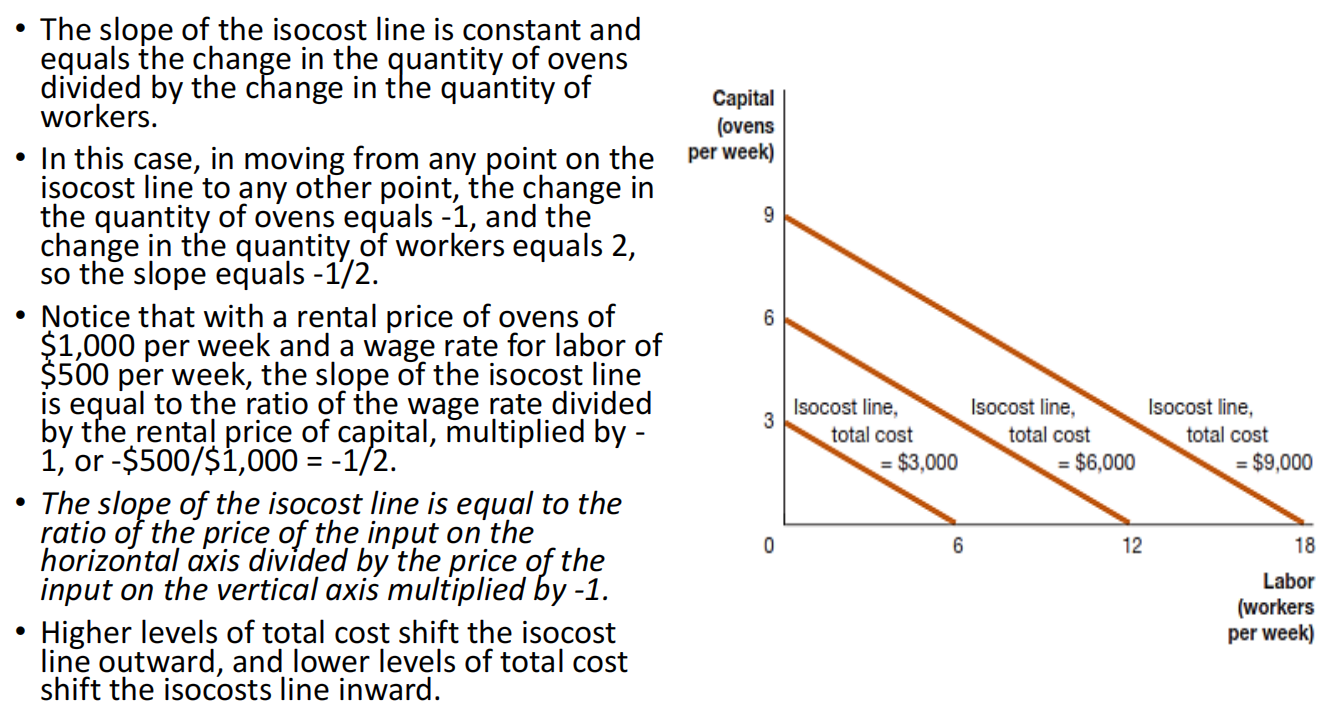
The slope of the isocost line is constant and equals the change in the quantity of ovens divided by the change in the quantity of workers.
📖 点击查看译文
等成本线的斜率是恒定的,等于烤箱数量的变化除以劳动数量的变化。
-
In this case, in moving from any point on the isocost line to any other point, the change in the quantity of ovens equals -1, and the change in the quantity of workers equals 2, so the slope equals -1/2.
📖 点击查看译文
在这种情况下,从等成本线上的任意一点移动到另一点,烤箱数量的变化为-1,劳动数量的变化为2,因此斜率为-1/2。
-
Notice that with a rental price of ovens of 500 per week, the slope of the isocost line is equal to the ratio of the wage rate divided by the rental price of capital, multiplied by -1, or -1,000 = -1/2.
📖 点击查看译文
注意,在烤箱租金为每周1,000美元、劳动工资率为每周500美元的情况下,等成本线的斜率等于工资率与资本租金价格的比率,乘以-1,即-1,000 = -1/2。
General Formula for the Slope of the Isocost Line
📖 点击查看译文
等成本线斜率的一般公式
-
The slope of the isocost line is equal to the ratio of the price of the input on the horizontal axis divided by the price of the input on the vertical axis multiplied by -1.
📖 点击查看译文
等成本线的斜率等于水平轴上输入价格与垂直轴上输入价格的比率,乘以-1。
Shifts of the Isocost Line
📖 点击查看译文
等成本线的移动
-
Higher levels of total cost shift the isocost line outward, and lower levels of total cost shift the isocost line inward.
📖 点击查看译文
总成本较高时,等成本线向外移动;总成本较低时,等成本线向内移动。
知识点列表与拓展 (Knowledge Points and Extensions):
1. Slope of the Isocost Line (等成本线的斜率)
-
解释 (Explanation):
The slope of the isocost line represents the rate at which one input can be substituted for another, based on the relative prices of the inputs. It is the ratio of the wage rate to the rental price of capital, multiplied by -1.
(等成本线的斜率表示在投入物价格相对的基础上,一个投入物替代另一个投入物的速率。它是工资率与资本租金价格的比率,乘以-1。)
-
例子 (Example):
If the price of labor is 1,000 per week, then the slope of the isocost line is -1/2.
(如果劳动价格为每周500美元,资本(烤箱)的价格为每周1,000美元,那么等成本线的斜率为-1/2。)
-
拓展 (Extension):
The isocost line shifts based on changes in total cost, allowing firms to compare various input combinations at different cost levels.
(等成本线会根据总成本的变化而移动,使得企业能够比较不同成本水平下的各种投入物组合。)
22
Choosing the Cost-Minimizing Combination of Capital and Labor
📖 点击查看译文
选择成本最小化的资本与劳动组合
-
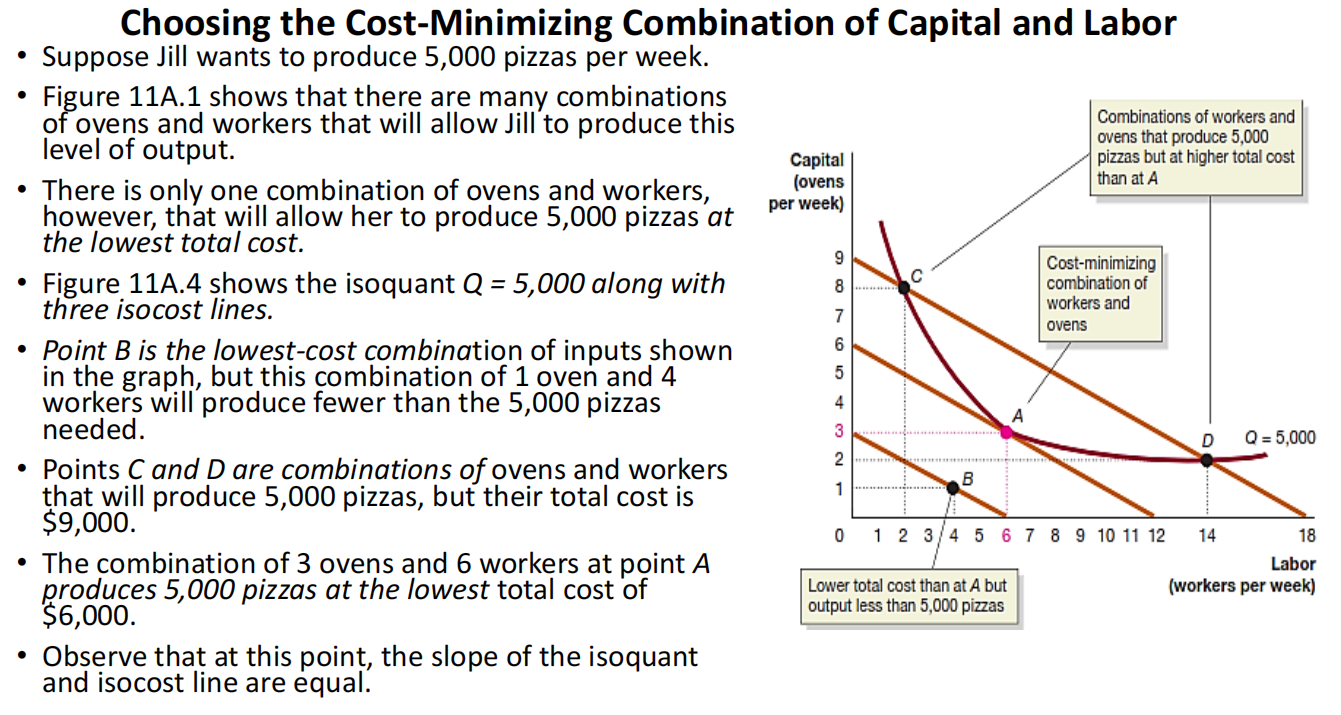
Suppose Jill wants to produce 5,000 pizzas per week.
📖 点击查看译文
假设Jill每周想生产5,000个比萨饼。
-
Figure 11A.1 shows that there are many combinations of ovens and workers that will allow Jill to produce this level of output.
📖 点击查看译文
图11A.1显示了许多烤箱和工人的组合,这些组合可以让Jill生产这个产量。
-
There is only one combination of ovens and workers, however, that will allow her to produce 5,000 pizzas at the lowest total cost.
📖 点击查看译文
然而,只有一种烤箱和工人的组合可以让她以最低的总成本生产5,000个比萨饼。
-
Figure 11A.4 shows the isoquant Q = 5,000 along with three isocost lines.
📖 点击查看译文
图11A.4展示了等产量线Q = 5,000以及三条等成本线。
-
Point B is the lowest-cost combination of inputs shown in the graph, but this combination of 1 oven and 4 workers will produce fewer than the 5,000 pizzas needed.
📖 点击查看译文
B点是图中显示的最低成本投入组合,但这种1个烤箱和4个工人的组合将生产少于5,000个比萨饼。
-
Points C and D are combinations of ovens and workers that will produce 5,000 pizzas, but their total cost is $9,000.
📖 点击查看译文
C点和D点是生产5,000个比萨饼的烤箱和工人组合,但它们的总成本是9,000美元。
-
The combination of 3 ovens and 6 workers at point A produces 5,000 pizzas at the lowest total cost of $6,000.
📖 点击查看译文
A点的3个烤箱和6个工人组合以6,000美元的最低总成本生产5,000个比萨饼。
-
Observe that at this point, the slope of the isoquant and isocost line are equal.
📖 点击查看译文
观察到在这一点上,等产量线和等成本线的斜率是相等的。
知识点列表与拓展 (Knowledge Points and Extensions):
1. Cost-Minimizing Input Combination (成本最小化的投入组合)
-
解释 (Explanation):
Firms must choose the combination of inputs that minimizes the total cost of production while achieving the desired level of output. The cost-minimizing combination occurs where the isoquant and isocost lines are tangent.
(企业必须选择能够以最低生产成本实现所需产量的投入组合。成本最小化的组合出现在等产量线和等成本线相切的地方。)
-
例子 (Example):
Jill’s optimal combination for producing 5,000 pizzas is 3 ovens and 6 workers at a cost of $6,000.
(Jill生产5,000个比萨饼的最佳组合是3个烤箱和6个工人,成本为6,000美元。)
-
拓展 (Extension):
The point where the slopes of the isoquant and isocost lines are equal represents the most efficient use of resources.
(等产量线和等成本线斜率相等的点代表了资源的最有效利用。)
The relationship between marginal cost and average total cost is critical for firms to determine the optimal level of production.
(边际成本与平均总成本之间的关系对企业确定最佳生产水平至关重要。)
2. U-shaped Cost Curves (U形成本曲线)
-
解释 (Explanation):
Both marginal cost and average total cost curves typically have a U shape, reflecting increasing returns to labor at first, followed by diminishing returns.
(边际成本和平均总成本曲线通常呈U形,反映了最初劳动的收益递增,然后是收益递减。)
-
例子 (Example):
As a pizza shop hires more workers, the first few workers increase output efficiently, causing costs to fall. However, after reaching a certain point, additional workers may overcrowd, causing costs to rise again.
(当披萨店雇佣更多工人时,前几个工人高效地增加产出,导致成本下降。然而,达到一定点后,额外的工人可能会导致拥挤,导致成本再次上升。)
-
拓展 (Extension):
Firms aim to operate where their average total cost curve is at its lowest point to maximize efficiency and minimize costs.
(企业旨在其平均总成本曲线最低点运作,以最大化效率并最小化成本。)
8

Graphing Cost Curves (成本曲线的绘制)
We know that total costs can be divided into fixed and variable costs:
📖 点击查看译文
我们知道总成本可以分为固定成本和变动成本:
TC = FC + VC
📖 点击查看译文
TC = FC + VC
Dividing both sides by output (Q) gives a useful relationship:
📖 点击查看译文
将两边除以产量(Q)得到一个有用的关系:
TC / Q = FC / Q + VC / Q
📖 点击查看译文
TC / Q = FC / Q + VC / Q
We can calculate average total cost by dividing total cost by the quantity of output produced.
📖 点击查看译文
我们可以通过将总成本除以生产的产量来计算平均总成本。
So, the first quantity is average total cost.
📖 点击查看译文
所以,第一个数量是平均总成本。
The second is average fixed cost: fixed cost divided by the quantity of output produced.
📖 点击查看译文
第二个是平均固定成本:固定成本除以生产的产量。
The third is average variable cost: variable cost divided by the quantity of output produced.
📖 点击查看译文
第三个是平均变动成本:变动成本除以生产的产量。
So ATC = AFC + AVC
📖 点击查看译文
所以 ATC = AFC + AVC
Important to Note (需要注意的重要事项)
1. The marginal cost (MC), average total cost (ATC), and average variable cost (AVC) curves are all U shaped, and the marginal cost curve intersects both the average variable cost curve and the average total cost curve at their minimum points.
📖 点击查看译文
1. 边际成本(MC)、平均总成本(ATC)和平均变动成本(AVC)曲线都是U形的,并且边际成本曲线在其最低点与平均变动成本曲线和平均总成本曲线相交。
2. When marginal cost is below either average variable cost or average total cost, it causes them to decrease.
📖 点击查看译文
2. 当边际成本低于平均变动成本或平均总成本时,它会导致它们下降。
3. When marginal cost is above average variable cost or average total cost, it causes them to increase.
📖 点击查看译文
3. 当边际成本高于平均变动成本或平均总成本时,它会导致它们上升。
4. Therefore, when marginal cost equals average variable cost or average total cost, they must be at their minimum points.
📖 点击查看译文
4. 因此,当边际成本等于平均变动成本或平均总成本时,它们必须处于最低点。
知识点列表与拓展 (Knowledge Points and Extensions):
1. Cost Curves (成本曲线)
-
解释 (Explanation):
Marginal cost, average total cost, and average variable cost curves all exhibit a U-shape, reflecting diminishing returns and the relationship between costs at different levels of output.
(边际成本、平均总成本和平均变动成本曲线都呈U形,反映了递减收益和不同产量水平下成本之间的关系。)
-
例子 (Example):
For a bakery, the marginal cost of producing one more loaf of bread may first decrease due to specialization, but after a certain point, it will rise as resources become limited.
(对于一家面包店,生产一块面包的边际成本可能首先下降,因为专业化,但在一定点之后,由于资源有限,成本将上升。)
-
拓展 (Extension):
Understanding the relationship between these cost curves helps businesses optimize their production to minimize costs and maximize profits.
(理解这些成本曲线之间的关系有助于企业优化生产,以最小化成本并最大化利润。)
2. Average Total Cost and Average Variable Cost (平均总成本与平均变动成本)
-
解释 (Explanation):
The average total cost is the total cost per unit of output, and the average variable cost is the variable cost per unit of output. These costs are integral to decision-making in production.
(平均总成本是每单位产出的总成本,平均变动成本是每单位产出的变动成本。这些成本对于生产决策至关重要。)
-
例子 (Example):
If the total fixed cost of a factory is 5, with 20 units produced, the average variable cost is $5, while the average total cost will include both fixed and variable costs.
(如果一个工厂的固定成本是100美元,单位变动成本是5美元,生产20个单位,则平均变动成本是5美元,而平均总成本将包括固定成本和变动成本。)
-
拓展 (Extension):
By analyzing these curves, firms can determine the most cost-effective production levels and adjust operations accordingly.
(通过分析这些曲线,企业可以确定最具成本效益的生产水平,并相应调整操作。)
9

Important Notes (重要说明)
2. As output increases, average fixed cost gets smaller and smaller.
📖 点击查看译文
2. 随着产量的增加,平均固定成本越来越小。
This result occurs because in calculating average fixed cost, we are dividing something that gets larger and larger, output, into something that remains constant, fixed cost.
📖 点击查看译文
这一结果的产生是因为在计算平均固定成本时,我们将不断增加的产量除以保持不变的固定成本。
Firms often refer to this process of lowering average fixed cost by selling more output as spreading the overhead.
📖 点击查看译文
企业通常将通过销售更多产出降低平均固定成本的过程称为分摊间接费用。
3. As output increases, the difference between average total cost and average variable cost decreases.
📖 点击查看译文
3. 随着产量的增加,平均总成本和平均变动成本之间的差距减少。
This result occurs because the difference between average total cost and average variable cost is average fixed cost, which gets smaller as output increases.
📖 点击查看译文
这一结果的产生是因为平均总成本和平均变动成本之间的差距是平均固定成本,而平均固定成本随着产量的增加而减小。
知识点列表与拓展 (Knowledge Points and Extensions):
1. Average Fixed Cost and Output (平均固定成本与产量)
-
解释 (Explanation):
As production increases, the average fixed cost decreases because fixed costs are spread across more units of output.
(随着生产增加,平均固定成本减少,因为固定成本被分摊到更多的产出单位上。)
-
例子 (Example):
A company that pays $1000 per month in rent will have a much lower average fixed cost per unit if it produces 100 units compared to producing just 10 units.
(一家每月支付1000美元租金的公司,如果生产100个单位,平均固定成本将比仅生产10个单位时要低得多。)
-
拓展 (Extension):
Understanding how average fixed cost decreases with output is crucial for businesses looking to optimize production levels and manage overhead costs efficiently.
(理解平均固定成本如何随着产量减少对企业优化生产水平和高效管理间接费用至关重要。)
2. Average Total Cost and Average Variable Cost (平均总成本与平均变动成本)
-
解释 (Explanation):
As output rises, the gap between average total cost and average variable cost decreases because fixed costs are spread over a larger number of units.
(随着产量上升,平均总成本和平均变动成本之间的差距减小,因为固定成本被分摊到更多单位的产出中。)
-
例子 (Example):
A company that produces 100 units has an average total cost that is closer to its average variable cost compared to when it produces just 10 units.
(一家生产100个单位的公司,其平均总成本与平均变动成本更接近,而不是生产仅10个单位时。)
-
拓展 (Extension):
Businesses can use this concept to understand how much of their total cost is due to fixed costs versus variable costs, and make more informed decisions about pricing and output levels.
(企业可以利用这一概念理解其总成本中有多少是由固定成本和变动成本构成的,并就定价和产量水平做出更明智的决策。)
10

11

Costs in the Long Run (长期成本)
Learning Objective: Understand how firms use the long-run average cost curve in their planning.
📖 点击查看译文
学习目标:理解企业如何在规划中使用长期平均成本曲线。
Recall that the long run is a sufficiently long period of time that all costs are variable.
📖 点击查看译文
回顾一下,长期是指一个足够长的时期,在这个时期内所有成本都是可变的。
So in the long run, there is no distinction between fixed and variable costs.
📖 点击查看译文
因此,在长期中,固定成本和变动成本之间没有区别。
For example, in the short run, Jill Johnson has fixed costs of $800 per week because she signed a loan agreement with a bank when she bought her pizza ovens.
📖 点击查看译文
例如,在短期内,Jill Johnson每周有800美元的固定成本,因为她在购买比萨饼烤箱时与银行签署了贷款协议。
But in the long run, the cost of buying more pizza ovens becomes variable because Jill can choose whether to expand her business by buying more of them.
📖 点击查看译文
但在长期内,购买更多比萨饼烤箱的成本变成了可变成本,因为Jill可以选择是否通过购买更多烤箱来扩大她的业务。
Once a company has purchased a fire insurance policy, the cost of the policy is fixed.
📖 点击查看译文
一旦公司购买了火灾保险单,保险费就是固定成本。
But when the policy expires, the company must decide whether to renew it, and the cost becomes variable.
📖 点击查看译文
但当保险单到期时,公司必须决定是否续保,费用变成了可变成本。
The important point is: In the long run, all costs are variable.
📖 点击查看译文
关键点是:在长期内,所有成本都是可变的。
There are no fixed costs in the long run.
📖 点击查看译文
在长期内没有固定成本。
In other words, in the long run, total cost equals variable cost, and average total cost equals average variable cost.
📖 点击查看译文
换句话说,在长期内,总成本等于可变成本,平均总成本等于平均变动成本。
知识点列表与拓展 (Knowledge Points and Extensions):
1. Long-Run Costs (长期成本)
-
解释 (Explanation):
In the long run, all costs become variable because firms can adjust all inputs, such as labor, capital, and equipment.
(在长期内,所有成本都变为可变成本,因为企业可以调整所有投入,如劳动力、资本和设备。)
-
例子 (Example):
A firm that initially has fixed costs for equipment and building rental can decide to buy new equipment or expand production capacity in the long run, turning those costs into variable costs.
(一开始有设备和建筑租赁固定成本的公司,在长期内可以决定购买新设备或扩大生产能力,将这些成本转化为可变成本。)
-
拓展 (Extension):
The long-run cost structure helps firms make decisions about investment, expansion, and scaling based on their ability to adjust all factors of production.
(长期成本结构帮助企业根据调整所有生产要素的能力做出投资、扩张和规模化决策。)
2. Fixed and Variable Costs in the Short Run vs. Long Run (短期与长期的固定成本与可变成本)
-
解释 (Explanation):
In the short run, firms have fixed costs, but in the long run, these costs become variable as firms can adjust their production processes and resources.
(在短期内,企业有固定成本,但在长期内,这些成本变为可变成本,因为企业可以调整生产过程和资源。)
-
例子 (Example):
A restaurant may have fixed costs in the short run for rent and utilities, but in the long run, it can choose to relocate or change its capacity, making these costs variable.
(餐厅在短期内可能有租金和水电费等固定成本,但在长期内,它可以选择搬迁或改变生产能力,使这些成本变为可变成本。)
-
拓展 (Extension):
This distinction is important for firms to understand when making long-term investment decisions, especially when considering factors like expansion and entering new markets.
(这一区别对于企业做出长期投资决策时尤其重要,特别是在考虑扩张和进入新市场等因素时。)
12

Economies of Scale (规模经济)
Short-run average cost curves represent the costs a firm faces when some input, such as the quantity of machines it uses, is fixed.
📖 点击查看译文
短期平均成本曲线代表了企业在某些投入(例如使用的机器数量)固定时所面临的成本。
The long-run average cost curve shows the lowest cost at which a firm is able to produce a given quantity of output in the long run, when no inputs are fixed.
📖 点击查看译文
长期平均成本曲线显示了企业在长期内能够以最低成本生产给定数量产出的成本,当所有投入都不固定时。
A firm may experience economies of scale, which means the firm’s long-run average costs fall as it increases the quantity of output it produces.
📖 点击查看译文
企业可能会经历规模经济,这意味着随着生产量的增加,企业的长期平均成本下降。
We can see the effects of economies of scale in Figure 11.6, which shows the relationship between short-run and long-run average cost curves.
📖 点击查看译文
我们可以在图11.6中看到规模经济的效果,该图展示了短期和长期平均成本曲线之间的关系。
Managers can use long-run average cost curves for planning because they show the effect on cost of expanding output by, for example, building a larger factory or restaurant.
📖 点击查看译文
管理者可以使用长期平均成本曲线进行规划,因为它们显示了通过扩大产量(例如建造更大的工厂或餐厅)对成本的影响。
知识点列表与拓展 (Knowledge Points and Extensions):
1. Economies of Scale (规模经济)
-
解释 (Explanation):
Economies of scale refer to the reduction in per-unit costs as a firm increases its output, due to more efficient utilization of resources.
(规模经济是指随着企业增加产量,单位成本下降,因为资源的利用更加高效。)
-
例子 (Example):
A factory producing bicycles might experience economies of scale by producing more bikes, reducing the cost per bike due to bulk purchasing of materials and more efficient machinery usage.
(生产自行车的工厂可能通过增加自行车的生产数量来实现规模经济,由于批量采购原材料和更高效的机器使用,单位自行车的成本降低。)
-
拓展 (Extension):
Understanding economies of scale helps firms make decisions about expansion, such as whether to build new facilities or increase production capacity.
(理解规模经济有助于企业做出扩张决策,例如是否建设新设施或增加生产能力。)
2. Short-Run vs. Long-Run Cost Curves (短期与长期成本曲线)
-
解释 (Explanation):
In the short run, firms face fixed inputs, leading to a U-shaped short-run average cost curve. In the long run, firms can vary all inputs, which leads to the long-run average cost curve, which may show declining costs as output increases.
(在短期内,企业面临固定投入,导致短期平均成本曲线呈U形。在长期内,企业可以调整所有投入,从而导致长期平均成本曲线,随着产量增加,成本可能下降。)
-
例子 (Example):
A restaurant may have fixed costs such as rent and utilities in the short run, but in the long run, it can expand or open new locations, allowing the business to spread its fixed costs over a larger output, thus reducing the average cost per meal.
(餐厅在短期内可能有固定的租金和水电费等成本,但在长期内,它可以扩展或开设新地点,从而使企业能够将固定成本分摊到更大的产量上,从而降低每餐的平均成本。)
-
拓展 (Extension):
The long-run average cost curve is essential for firms when making strategic decisions about capacity and market entry or exit.
(长期平均成本曲线对于企业在做出有关产能和市场进出决策时至关重要。)
3. Application of Long-Run Average Cost Curve (长期平均成本曲线的应用)
-
解释 (Explanation):
Managers use long-run average cost curves to determine the optimal scale of operations and guide long-term investment decisions.
(管理者使用长期平均成本曲线来确定最佳运营规模,并指导长期投资决策。)
-
例子 (Example):
A company looking to expand production may use the long-run average cost curve to decide whether it should invest in building a new facility or increase capacity at its existing plant.
(一家想要扩大生产的公司可能会使用长期平均成本曲线来决定是否应投资建设新设施或增加现有工厂的产能。)
-
拓展 (Extension):
The long-run average cost curve is influenced by factors like technology, economies of scale, and managerial efficiency, which all play a role in shaping long-term cost structures.
(长期平均成本曲线受到技术、规模经济和管理效率等因素的影响,这些因素在塑造长期成本结构中起着重要作用。)
13

Long-Run Average Cost Curves for Automobile Factories (汽车工厂的长期平均成本曲线)
Figure 11.6 shows long-run average cost in the automobile industry. If a small company, such as Tesla Motors, expects to sell only 20,000 cars per year, then it will be able to assemble cars at the lowest average cost of $52,000 per car if it builds a small factory, as represented by the ATC curve on the left of the figure.
📖 点击查看译文
图11.6展示了汽车行业的长期平均成本。如果像特斯拉这样的公司预计每年只卖2万辆车,那么如果它建造一个小型工厂,它将能够以每辆车52,000美元的最低平均成本来组装汽车,正如图中左侧的ATC曲线所表示。
A much larger factory, such as those operated by Ford, General Motors, and Toyota, will be able to produce 200,000 cars per year at a lower average cost of $27,000 per car.
📖 点击查看译文
像福特、通用和丰田这样的更大型工厂,每年能够生产20万辆车,每辆车的平均成本为27,000美元,低于小型工厂。
This decline in average cost from 27,000 represents the economies of scale that exist in manufacturing automobiles.
📖 点击查看译文
从52,000美元到27,000美元的平均成本下降代表了汽车制造中的规模经济。
Why would the larger automobile factory have lower average costs?
📖 点击查看译文
为什么更大的汽车工厂会有更低的平均成本?
One important reason is that a company like Ford is producing 10 times as many cars per year in one of its factories as Tesla produces in its factory but might need only 6 times as many workers. This saving in labor cost would reduce Ford’s average cost of selling cars.
📖 点击查看译文
一个重要原因是,像福特这样的公司每年在一个工厂生产的汽车是特斯拉工厂的10倍,但可能只需要6倍的工人。这种劳动力成本的节省将降低福特的汽车销售平均成本。
In general, firms may experience economies of scale for a number of reasons, with these being the most important:
📖 点击查看译文
一般来说,企业可能会由于多种原因经历规模经济,其中最重要的原因如下:
- As in the case of automobile production, the firm’s technology may make it possible to increase production with a smaller proportional increase in at least one input.
📖 点击查看译文
与汽车生产的情况类似,公司的技术可能使得生产能够在至少一个投入上以较小的比例增加生产。
- Both workers and managers can become more specialized, enabling them to become more productive, as output expands.
📖 点击查看译文
随着产出的扩展,工人和管理者可以变得更加专业化,从而提高生产力。
- Large firms, like Ford, Walmart, or Apple, may be able to purchase inputs at lower costs than smaller competitors due to higher bargaining power.
📖 点击查看译文
像福特、沃尔玛或苹果这样的大型公司,可能由于更高的议价能力,能够以比小型竞争对手更低的成本购买投入品。
知识点列表与拓展 (Knowledge Points and Extensions):
1. Economies of Scale in Automobile Manufacturing (汽车制造中的规模经济)
-
解释 (Explanation):
Economies of scale in the automobile industry allow larger firms to reduce per-unit costs by increasing production. This can be attributed to factors such as more efficient use of labor, technology improvements, and bulk purchasing.
(汽车行业中的规模经济使得更大的企业通过增加生产来降低单位成本。这可以归因于劳动力利用效率提高、技术改进和批量采购等因素。)
-
例子 (Example):
A large car manufacturer like Toyota can produce cars at a lower average cost per unit compared to a smaller company like Tesla due to its ability to spread fixed costs over more units and utilize resources more efficiently.
(像丰田这样的大型汽车制造商能够比特斯拉这样的小公司以更低的单位成本生产汽车,因为它能够将固定成本分摊到更多的单位上,并更高效地利用资源。)
-
拓展 (Extension):
Understanding economies of scale is vital for companies when deciding whether to expand production capacity or enter new markets, as it influences pricing strategies and profitability.
(理解规模经济对于公司决定是否扩展生产能力或进入新市场至关重要,因为它影响定价策略和盈利能力。)
2. Specialization and Division of Labor (专业化与劳动分工)
-
解释 (Explanation):
As firms grow, workers and managers can specialize in specific tasks, leading to greater efficiency and productivity.
(随着企业的增长,工人和管理者可以在特定任务上进行专业化,从而提高效率和生产力。)
-
例子 (Example):
In large firms like Ford, managers and workers can specialize in their areas of expertise, which makes them more productive than in smaller companies where workers might perform a variety of tasks.
(在像福特这样的大型公司中,管理者和工人可以在各自的专业领域进行专业化,从而比在小公司中从事多种任务的工人更具生产力。)
-
拓展 (Extension):
Specialization is a key factor in the growth of large firms and the realization of economies of scale. As production volume increases, workers can focus on specific tasks, improving overall productivity.
(专业化是大型公司增长和实现规模经济的关键因素。随着生产量的增加,工人可以专注于特定任务,从而提高整体生产力。)
3. Bargaining Power and Bulk Purchasing (议价能力与批量采购)
-
解释 (Explanation):
Larger firms have greater bargaining power, which allows them to purchase inputs in bulk at a lower cost, contributing to lower average costs.
(大型企业拥有更强的议价能力,这使得它们能够以更低的成本批量采购投入品,从而降低平均成本。)
-
例子 (Example):
Large retailers like Walmart can negotiate lower prices with suppliers for bulk purchases of goods, giving them a cost advantage over smaller competitors.
(像沃尔玛这样的零售巨头可以与供应商谈判,获得批量购买商品的更低价格,从而在成本上占据优势。)
-
拓展 (Extension):
Bargaining power is an essential tool for large firms, not only in reducing input costs but also in negotiating favorable terms for logistics, marketing, and other operational aspects.
(议价能力是大型公司的一项重要工具,不仅可以降低投入成本,还能在物流、营销和其他运营方面谈判获得有利条款。)
14

4. As a firm expands, it may be able to borrow money at a lower interest rate, thereby lowering its costs. (随着企业扩张,它可能能够以更低的利率借款,从而降低其成本)
The long-run average cost curve in most industries has a flat segment that often stretches over a substantial range of output.
📖 点击查看译文
大多数行业的长期平均成本曲线都有一个平坦的部分,通常覆盖较大范围的产量。
As Figure 11.6 shows, an automobile factory producing 200,000 cars per year and a factory producing 400,000 cars per year have the same average cost.
📖 点击查看译文
如图11.6所示,每年生产20万辆汽车的汽车工厂与生产40万辆汽车的工厂具有相同的平均成本。
Over this range of output, firms in the industry experience constant returns to scale.
📖 点击查看译文
在这一产量范围内,行业内的企业经历了规模报酬不变的情况。
As these firms increase their output, they increase their inputs, such as the size of the factory and the quantity of workers, proportionally.
📖 点击查看译文
随着这些公司增加产量,它们也按比例增加投入,如工厂规模和工人数量。
The level of output at which all economies of scale are exhausted is known as minimum efficient scale.
📖 点击查看译文
当所有规模经济都被消耗完毕时的产量水平被称为最小有效规模。
知识点列表与拓展 (Knowledge Points and Extensions):
1. Borrowing at Lower Interest Rates (以较低利率借款)
-
解释 (Explanation):
As firms expand, they may gain access to better financing options, including borrowing at lower interest rates. This can lower their overall costs by reducing the interest expenses on loans.
(随着企业的扩张,它们可能能够获得更好的融资选择,包括以更低的利率借款。这可以通过减少贷款的利息支出来降低企业的整体成本。)
-
例子 (Example):
A large firm like Walmart can borrow money at a lower interest rate than a smaller competitor due to its higher creditworthiness and market presence.
(像沃尔玛这样的大型公司,由于更高的信用度和市场影响力,可以以更低的利率借款,而小型竞争者则不具备此优势。)
-
拓展 (Extension):
Firms can further reduce their costs by using the saved interest to invest in more efficient technology, research, or infrastructure that enhances productivity.
(企业可以通过将节省下来的利息用于投资更高效的技术、研究或基础设施来进一步降低成本,提升生产力。)
2. Constant Returns to Scale (规模报酬不变)
-
解释 (Explanation):
In the range of output where firms experience constant returns to scale, increasing all inputs by a certain proportion leads to an equal proportional increase in output.
(在企业经历规模报酬不变的产量范围内,按一定比例增加所有投入将导致产量按相同比例增加。)
-
例子 (Example):
A factory that doubles its size by adding more workers and machinery can double its output, thus maintaining the same average cost per unit of production.
(一个通过增加更多工人和机器来将工厂规模翻倍的工厂可以将产量翻倍,从而保持每单位生产的相同平均成本。)
-
拓展 (Extension):
Constant returns to scale are significant for firms when they reach an optimal level of output, as they can maintain low per-unit costs while scaling production without experiencing inefficiencies.
(规模报酬不变对企业在达到最佳产出水平时至关重要,因为它们可以在扩大生产的同时保持低单位成本,而不会出现效率低下的问题。)
3. Minimum Efficient Scale (最小有效规模)
-
解释 (Explanation):
The minimum efficient scale is the point at which a firm has exhausted all economies of scale, and any further increases in production do not lower average costs.
(最小有效规模是企业已耗尽所有规模经济的点,任何进一步增加生产都不会降低平均成本。)
-
例子 (Example):
A firm in the automobile industry may reach the minimum efficient scale when it can produce 100,000 cars per year, after which increasing output no longer results in lower costs per car.
(一家汽车行业的公司可能在每年生产10万辆汽车时达到最小有效规模,此后增加产量将不再导致每辆车成本的降低。)
-
拓展 (Extension):
Firms that do not reach the minimum efficient scale may struggle to compete in terms of costs, as they cannot fully exploit economies of scale to reduce their average costs.
(未能达到最小有效规模的公司可能在成本方面难以竞争,因为它们无法充分利用规模经济来降低平均成本。)
15

An automobile factory producing 200,000 cars per year has reached minimum efficient scale.
📖 点击查看译文
每年生产20万辆汽车的工厂已达到最小有效规模。
Firms that produce at less than minimum efficient scale may have difficulty surviving because they will be producing output at higher cost than competitors.
📖 点击查看译文
生产低于最小有效规模的公司可能难以生存,因为它们的生产成本高于竞争对手。
Very large automobile factories experience increasing average costs as managers begin to have difficulty coordinating the operation of the factory.
📖 点击查看译文
非常大的汽车工厂在管理者开始难以协调工厂运营时,会经历平均成本上升。
Figure 11.6 shows that for production above 400,000 cars per year, firms in the industry experience diseconomies of scale.
📖 点击查看译文
图11.6显示,每年生产超过40万辆汽车的公司在行业中会经历规模不经济。
For instance, Toyota found that as it expanded production at its Georgetown, Kentucky, plant and its plants in China, its managers had difficulty keeping average cost from rising.
📖 点击查看译文
例如,丰田发现,在其肯塔基州乔治敦工厂和中国工厂扩张生产时,管理者难以控制平均成本不上涨。
One analysis of the problems Toyota faced in expanding production concluded: “It is the kind of paradox many highly successful companies face: Getting bigger doesn’t always mean getting better.”
📖 点击查看译文
对丰田扩张生产问题的分析得出结论:“这是许多非常成功的公司面临的悖论:变大不一定意味着变好。”
知识点列表与拓展 (Knowledge Points and Extensions):
1. Minimum Efficient Scale (最小有效规模)
-
解释 (Explanation):
The minimum efficient scale is the output level where a firm experiences the lowest average cost. Firms below this level face higher costs than competitors.
(最小有效规模是企业经历最低平均成本的产出水平。低于此水平的公司面临的成本高于竞争对手。)
-
例子 (Example):
A small factory may produce fewer cars than the minimum efficient scale and thus incur higher costs than larger factories that can exploit economies of scale.
(一个小工厂可能生产的汽车少于最小有效规模,因此会承担比大型工厂更高的成本,而后者可以利用规模经济。)
-
拓展 (Extension):
Firms must carefully assess their scale of production to remain competitive. If they are unable to reach minimum efficient scale, they may struggle to compete on cost efficiency.
(企业必须仔细评估其生产规模以保持竞争力。如果它们无法达到最小有效规模,可能会在成本效率上难以竞争。)
2. Diseconomies of Scale (规模不经济)
-
解释 (Explanation):
Diseconomies of scale occur when a firm’s average costs rise as it increases its output beyond a certain level.
(规模不经济是指当企业的产量超过某一水平时,平均成本上升的情况。)
-
例子 (Example):
Toyota’s experience in expanding its factories beyond a certain capacity led to increasing management complexity and higher costs.
(丰田在其工厂超出某一生产能力后的扩张经历了管理复杂性增加和成本上升的问题。)
-
拓展 (Extension):
Diseconomies of scale may arise due to factors such as increased coordination challenges, bureaucratic inefficiencies, or difficulties in managing a larger workforce.
(规模不经济可能由协调挑战增加、官僚效率低下或管理更大员工队伍的困难等因素引起。)
3. Paradox of Growth (增长的悖论)
-
解释 (Explanation):
The paradox of growth is when increasing the size of a firm does not result in improved performance or efficiency.
(增长的悖论是指扩大企业规模并没有导致表现或效率的提高。)
-
例子 (Example):
Many companies face this paradox, where they may struggle to maintain efficiency and profitability as they grow beyond a certain point.
(许多公司都面临这一悖论,当它们的规模超过某一临界点时,可能会难以保持效率和盈利能力。)
-
拓展 (Extension):
Companies need to manage growth strategically, ensuring that scaling up operations is accompanied by improvements in organizational processes and management practices.
(公司需要战略性地管理增长,确保扩大运营的同时,组织流程和管理实践也得到改进。)
16

17

Appendix: Using Isoquants and Isocost Lines to Understand Production and Cost
📖 点击查看译文
附录:使用等产量曲线和等成本线理解生产和成本
Suppose a firm has determined that it wants to produce a particular level of output. What determines the cost of that output?
📖 点击查看译文
假设一个公司已确定希望生产一定水平的产量。是什么决定了该产量的成本?
1. Technology
📖 点击查看译文
1. 技术
-
In what ways can inputs be combined to produce output?
📖 点击查看译文
以何种方式将投入物组合以生产产出?
2. Input prices
📖 点击查看译文
2. 投入价格
-
What is the cost of each input compared with the other? That is, what is the relative price of each input?
📖 点击查看译文
每种投入物的成本与其他投入物相比如何?也就是说,每种投入物的相对价格是多少?
If a firm’s technology allows one input to be substituted for the other in order to maintain the same level of production, then many combinations of inputs may produce the same level of output.
📖 点击查看译文
如果公司的技术允许将一种投入物替代为另一种,以保持相同的生产水平,那么许多投入物的组合可能会产生相同的产量。
For example, Jill Johnson is able to produce 5000 pizzas with either:
📖 点击查看译文
例如,Jill Johnson能够通过以下两种方式生产5000个披萨:
- 6 workers and 3 ovens
📖 点击查看译文
6个工人和3个烤箱
- 10 workers and 2 ovens
📖 点击查看译文
10个工人和2个烤箱
知识点列表与拓展 (Knowledge Points and Extensions):
1. Isoquants (等产量曲线)
-
解释 (Explanation):
Isoquants show different combinations of inputs that produce the same level of output. They are similar to indifference curves in consumer theory.
(等产量曲线显示生产相同产量的不同投入物组合。它们类似于消费者理论中的无差异曲线。)
-
例子 (Example):
Jill’s production choices of 6 workers and 3 ovens or 10 workers and 2 ovens both allow for the same output level of 5000 pizzas, but they represent different input combinations.
(Jill选择6个工人和3个烤箱或10个工人和2个烤箱都能产生相同的5000个披萨,但它们代表不同的投入物组合。)
-
拓展 (Extension):
Firms can use isoquants to find the most cost-effective combination of inputs. This allows firms to explore trade-offs between different input combinations.
(企业可以使用等产量曲线找到最具成本效益的投入物组合。这使得企业可以探索不同投入物组合之间的权衡。)
2. Isocost Lines (等成本线)
-
解释 (Explanation):
Isocost lines represent the different combinations of inputs that cost the same total amount.
(等成本线表示不同的投入物组合,这些组合的总成本相同。)
-
例子 (Example):
If Jill wants to spend a specific amount on labor and ovens, the isocost line shows all combinations of labor and ovens she can afford within that budget.
(如果Jill希望在劳动力和烤箱上花费特定金额,等成本线将显示她在该预算范围内能够负担的所有劳动力和烤箱的组合。)
-
拓展 (Extension):
Firms use isocost lines to determine which combinations of inputs are affordable given their budget constraints. The optimal combination of inputs lies where the isocost line is tangent to the isoquant.
(企业使用等成本线来确定在其预算限制下哪些投入物组合是负担得起的。最优的投入物组合位于等成本线与等产量曲线相切的地方。)
18

Understanding the Cost-Minimizing Combination of Inputs
📖 点击查看译文
理解成本最小化的投入物组合
Firms search for the cost-minimizing combination of inputs that will allow them to produce a given level of output. This depends on two factors:
📖 点击查看译文
企业寻求成本最小化的投入物组合,以便生产给定水平的产出。这取决于两个因素:
-
Technology
📖 点击查看译文
技术
-
Technology determines how much output a firm receives from employing a given quantity of inputs.
📖 点击查看译文
技术决定了企业使用给定数量的投入物可以获得多少产出。
-
-
Input Prices
📖 点击查看译文
投入物价格
-
Input prices determine the total cost of each combination of inputs.
📖 点击查看译文
投入物价格决定了每种投入物组合的总成本。
-
Graphing the Output Levels: Jill’s Example
📖 点击查看译文
绘制产出水平:Jill的例子
-
Jill can produce different levels of output using different combinations of two inputs:
-
Labor – The number of workers she hires per week.
-
Capital – The number of ovens she uses per week.
-
Isoquants: A Curve Showing Input Combinations for the Same Output
📖 点击查看译文
等产量曲线:显示生产相同产出的投入物组合的曲线
-
An isoquant is a curve showing all combinations of two inputs, such as capital and labor, that will produce the same level of output.
📖 点击查看译文
等产量曲线是显示所有两种投入物组合(例如资本和劳动)能够生产相同产出水平的曲线。
知识点列表与拓展 (Knowledge Points and Extensions):
1. Isoquants (等产量曲线)
-
解释 (Explanation):
Isoquants are similar to indifference curves in consumer theory, but for production. They show the different input combinations that can produce the same level of output.
(等产量曲线类似于消费者理论中的无差异曲线,但用于生产。它们显示了能生产相同产量的不同投入物组合。)
-
例子 (Example):
Jill could choose different combinations of labor (workers) and capital (ovens) to produce 5000 pizzas, such as 6 workers and 3 ovens or 10 workers and 2 ovens.
(Jill可以选择不同的劳动(工人)和资本(烤箱)组合来生产5000个披萨,例如6个工人和3个烤箱,或10个工人和2个烤箱。)
-
拓展 (Extension):
Firms use isoquants to understand how they can substitute one input for another, or how much of each input is needed to produce a certain output level.
(企业使用等产量曲线来了解如何将一种投入物替代为另一种投入物,或者生产特定产量水平需要多少每种投入物。)
2. Input Substitution (投入物替代)
-
解释 (Explanation):
Firms often substitute one input for another, such as using more labor and fewer ovens or vice versa, depending on the prices of the inputs and the technology available.
(企业通常会将一种投入物替代为另一种,例如根据投入物的价格和可用的技术,使用更多的劳动和更少的烤箱,或者反之。)
-
例子 (Example):
Jill may substitute more workers for ovens if labor is cheaper than capital or if technology allows for increased productivity with more workers.
(如果劳动比资本便宜,或者技术允许通过增加工人提高生产率,Jill可能会将更多的工人替代为烤箱。)
-
拓展 (Extension):
The ability to substitute inputs efficiently depends on the firm’s production technology, which dictates the relationship between the inputs and output.
(有效地替代投入物的能力取决于企业的生产技术,这决定了投入物与产出之间的关系。)
19

Isoquants and Marginal Rate of Technical Substitution (MRTS)
📖 点击查看译文
等产量曲线与技术替代的边际率(MRTS)
More Inputs and Higher Production Levels
📖 点击查看译文
更多的投入物和更高的生产水平
-
More inputs would allow a higher level of production.
📖 点击查看译文
更多的投入物将允许更高的生产水平。
-
For example, with 12 workers and 4 ovens, Jill’s restaurant could produce 10,000 pizzas.
📖 点击查看译文
例如,使用12个工人和4个烤箱,Jill的餐厅可以生产10,000个披萨。
-
Isoquants for Different Levels of Output
📖 点击查看译文
不同产出水平的等产量曲线
-
A new isoquant describes all combinations of inputs that could produce 10,000 pizzas.
📖 点击查看译文
新的等产量曲线描述了所有能够生产10,000个披萨的投入物组合。
-
Greater production would require more inputs.
📖 点击查看译文
更高的生产水平将需要更多的投入物。
The Marginal Rate of Technical Substitution (MRTS)
📖 点击查看译文
技术替代的边际率(MRTS)
-
The slope of an isoquant describes how many units of capital are required to compensate for a unit of labor, keeping production constant.
📖 点击查看译文
等产量曲线的斜率描述了为了补偿一个单位劳动所需要的资本单位数,以保持生产水平不变。
-
This is known as the Marginal Rate of Technical Substitution (MRTS).
📖 点击查看译文
这被称为技术替代的边际率(MRTS)。
-
For example, between point A and point B, 1 oven can compensate for 4 workers, so the MRTS = 1/4.
📖 点击查看译文
例如,在A点和B点之间,1个烤箱可以补偿4个工人,因此MRTS = 1/4。
Changes in MRTS Along an Isoquant
📖 点击查看译文
沿等产量曲线的MRTS变化
-
We expect the MRTS to change as we move down an isoquant.
📖 点击查看译文
我们预计MRTS会随着沿等产量曲线的移动而发生变化。
-
At a point like A on the isoquant for Q = 5,000, the isoquant is relatively steep.
📖 点击查看译文
例如,在等产量曲线Q = 5,000的A点,等产量曲线相对陡峭。
-
As we move down the curve, the isoquant becomes less steep at a point like B.
📖 点击查看译文
随着沿曲线的下移,等产量曲线在B点变得不那么陡峭。
Convex Shape of Isoquants
📖 点击查看译文
等产量曲线的凸形状
-
Isoquants are bowed in or convex.
📖 点击查看译文
等产量曲线是向内弯曲的,或是凸形的。
-
The reason isoquants have this shape is that as we move down the curve, we continue to substitute labor for capital.
📖 点击查看译文
等产量曲线具有这种形状的原因是,随着沿曲线的下移,我们继续将劳动替代为资本。
-
As the firm produces the same quantity of output using less capital, the additional labor it needs increases due to diminishing returns.
📖 点击查看译文
随着公司使用较少的资本生产相同数量的产出,所需的额外劳动增加,因为收益递减。
知识点列表与拓展 (Knowledge Points and Extensions):
1. Marginal Rate of Technical Substitution (MRTS) (技术替代的边际率)
-
解释 (Explanation):
The MRTS represents how many units of one input are needed to substitute for another input, keeping output constant. It is reflected in the slope of an isoquant.
(MRTS表示为保持产出不变,替代一种投入物所需要的另一种投入物的数量。它反映在等产量曲线的斜率中。)
-
例子 (Example):
If Jill’s restaurant needs 1 oven to replace 4 workers, the MRTS is 1/4.
(如果Jill的餐厅需要1个烤箱来替代4个工人,则MRTS为1/4。)
-
拓展 (Extension):
MRTS can change along an isoquant, reflecting diminishing returns as more labor is substituted for capital.
(MRTS可以沿等产量曲线发生变化,反映出随着更多劳动替代资本,收益递减的现象。)
2. Isoquant Shape (等产量曲线形状)
-
解释 (Explanation):
Isoquants are convex due to diminishing returns as inputs are substituted for one another.
(等产量曲线是凸形的,因为在投入物相互替代的过程中存在收益递减现象。)
-
例子 (Example):
As more labor is substituted for capital, each additional unit of labor is less effective in increasing output.
(随着更多劳动替代资本,每增加一个单位的劳动,对产出的增加效果减弱。)
-
拓展 (Extension):
Firms aim to minimize costs by choosing the optimal combination of inputs along the isoquant.
(企业通过选择沿等产量曲线的最佳投入物组合来最小化成本。)
20

Isocost Lines
📖 点击查看译文
等成本线
Defining Isocost Lines
📖 点击查看译文
定义等成本线
-
A firm wants to produce a given quantity of output at the lowest possible cost.
📖 点击查看译文
企业希望以最低成本生产一定数量的产出。
-
We can show the relationship between the quantity of inputs used and the firm’s total cost by using an isocost line.
📖 点击查看译文
我们可以通过使用等成本线显示投入物的数量与企业总成本之间的关系。
-
An isocost line shows all the combinations of two inputs, such as capital and labor, that have the same total cost.
📖 点击查看译文
等成本线显示了具有相同总成本的两种投入物组合,例如资本和劳动。
Example of Isocost Line
📖 点击查看译文
等成本线示例
-
Suppose that Jill has $6,000 per week to spend on capital and labor.
📖 点击查看译文
假设Jill每周有6,000美元可以用于购买资本和劳动。
-
If the rental price of ovens is 500 per week, then Jill can choose various combinations of capital and labor to stay within the budget.
📖 点击查看译文
如果烤箱的租金是每周1,000美元,工资率是每周500美元,那么Jill可以选择不同的资本和劳动组合来保持在预算范围内。
-
The graph uses the data in the table to construct an isocost line.
📖 点击查看译文
图表使用表中的数据来构造等成本线。
知识点列表与拓展 (Knowledge Points and Extensions):
1. Isocost Line (等成本线)
-
解释 (Explanation):
An isocost line represents the total cost of different combinations of inputs, where the cost remains constant. It helps to identify the cost-minimizing input combinations for a firm.
(等成本线表示不同投入物组合的总成本,其中成本保持不变。它有助于识别企业的成本最小化投入物组合。)
-
例子 (Example):
With a 1,000 for capital and $500 for labor, Jill can use the isocost line to find all possible input combinations.
(假设Jill每周有6,000美元预算,资本租金为1,000美元,劳动工资为500美元,Jill可以通过等成本线找到所有可能的投入物组合。)
-
拓展 (Extension):
Firms use isocost lines in conjunction with isoquants to identify the least-cost combination of inputs to produce a given level of output.
(企业将等成本线与等产量曲线结合使用,以确定生产给定产出水平的最小成本投入物组合。)
21

Slope of the Isocost Line
📖 点击查看译文
等成本线的斜率
Slope of the Isocost Line Explanation
📖 点击查看译文
等成本线斜率解释
-
The slope of the isocost line is constant and equals the change in the quantity of ovens divided by the change in the quantity of workers.
📖 点击查看译文
等成本线的斜率是恒定的,等于烤箱数量的变化除以劳动数量的变化。
-
In this case, in moving from any point on the isocost line to any other point, the change in the quantity of ovens equals -1, and the change in the quantity of workers equals 2, so the slope equals -1/2.
📖 点击查看译文
在这种情况下,从等成本线上的任意一点移动到另一点,烤箱数量的变化为-1,劳动数量的变化为2,因此斜率为-1/2。
-
Notice that with a rental price of ovens of 500 per week, the slope of the isocost line is equal to the ratio of the wage rate divided by the rental price of capital, multiplied by -1, or -1,000 = -1/2.
📖 点击查看译文
注意,在烤箱租金为每周1,000美元、劳动工资率为每周500美元的情况下,等成本线的斜率等于工资率与资本租金价格的比率,乘以-1,即-1,000 = -1/2。
General Formula for the Slope of the Isocost Line
📖 点击查看译文
等成本线斜率的一般公式
-
The slope of the isocost line is equal to the ratio of the price of the input on the horizontal axis divided by the price of the input on the vertical axis multiplied by -1.
📖 点击查看译文
等成本线的斜率等于水平轴上输入价格与垂直轴上输入价格的比率,乘以-1。
Shifts of the Isocost Line
📖 点击查看译文
等成本线的移动
-
Higher levels of total cost shift the isocost line outward, and lower levels of total cost shift the isocost line inward.
📖 点击查看译文
总成本较高时,等成本线向外移动;总成本较低时,等成本线向内移动。
知识点列表与拓展 (Knowledge Points and Extensions):
1. Slope of the Isocost Line (等成本线的斜率)
-
解释 (Explanation):
The slope of the isocost line represents the rate at which one input can be substituted for another, based on the relative prices of the inputs. It is the ratio of the wage rate to the rental price of capital, multiplied by -1.
(等成本线的斜率表示在投入物价格相对的基础上,一个投入物替代另一个投入物的速率。它是工资率与资本租金价格的比率,乘以-1。)
-
例子 (Example):
If the price of labor is 1,000 per week, then the slope of the isocost line is -1/2.
(如果劳动价格为每周500美元,资本(烤箱)的价格为每周1,000美元,那么等成本线的斜率为-1/2。)
-
拓展 (Extension):
The isocost line shifts based on changes in total cost, allowing firms to compare various input combinations at different cost levels.
(等成本线会根据总成本的变化而移动,使得企业能够比较不同成本水平下的各种投入物组合。)
22

Choosing the Cost-Minimizing Combination of Capital and Labor
📖 点击查看译文
选择成本最小化的资本与劳动组合
-
Suppose Jill wants to produce 5,000 pizzas per week.
📖 点击查看译文
假设Jill每周想生产5,000个比萨饼。
-
Figure 11A.1 shows that there are many combinations of ovens and workers that will allow Jill to produce this level of output.
📖 点击查看译文
图11A.1显示了许多烤箱和工人的组合,这些组合可以让Jill生产这个产量。
-
There is only one combination of ovens and workers, however, that will allow her to produce 5,000 pizzas at the lowest total cost.
📖 点击查看译文
然而,只有一种烤箱和工人的组合可以让她以最低的总成本生产5,000个比萨饼。
-
Figure 11A.4 shows the isoquant Q = 5,000 along with three isocost lines.
📖 点击查看译文
图11A.4展示了等产量线Q = 5,000以及三条等成本线。
-
Point B is the lowest-cost combination of inputs shown in the graph, but this combination of 1 oven and 4 workers will produce fewer than the 5,000 pizzas needed.
📖 点击查看译文
B点是图中显示的最低成本投入组合,但这种1个烤箱和4个工人的组合将生产少于5,000个比萨饼。
-
Points C and D are combinations of ovens and workers that will produce 5,000 pizzas, but their total cost is $9,000.
📖 点击查看译文
C点和D点是生产5,000个比萨饼的烤箱和工人组合,但它们的总成本是9,000美元。
-
The combination of 3 ovens and 6 workers at point A produces 5,000 pizzas at the lowest total cost of $6,000.
📖 点击查看译文
A点的3个烤箱和6个工人组合以6,000美元的最低总成本生产5,000个比萨饼。
-
Observe that at this point, the slope of the isoquant and isocost line are equal.
📖 点击查看译文
观察到在这一点上,等产量线和等成本线的斜率是相等的。
知识点列表与拓展 (Knowledge Points and Extensions):
1. Cost-Minimizing Input Combination (成本最小化的投入组合)
-
解释 (Explanation):
Firms must choose the combination of inputs that minimizes the total cost of production while achieving the desired level of output. The cost-minimizing combination occurs where the isoquant and isocost lines are tangent.
(企业必须选择能够以最低生产成本实现所需产量的投入组合。成本最小化的组合出现在等产量线和等成本线相切的地方。)
-
例子 (Example):
Jill’s optimal combination for producing 5,000 pizzas is 3 ovens and 6 workers at a cost of $6,000.
(Jill生产5,000个比萨饼的最佳组合是3个烤箱和6个工人,成本为6,000美元。)
-
拓展 (Extension):
The point where the slopes of the isoquant and isocost lines are equal represents the most efficient use of resources.
(等产量线和等成本线斜率相等的点代表了资源的最有效利用。)
评论
0 条正在加载评论...